Introduction
JRI MySirius is a hosted (Cloud JRI MySirius) monitoring system operating with connected sensors. Notifications can be sent by the system in real time if any incident occurs. For an optimum operation, it is important to configure MySirius correctly by following the steps bellow:
- Equipement Installation and declaration
- Gateway (Nano SPY LINK)
- Relay/Alarm (Nano SPY ALARM)
- Connected probes (Nova SPY, Nano SPY et LoRa® SPY)
- Create the monitored units
- Create the batches
- Create the alerts
- Create the users
Definitions
Unit / Monitored Unit
A monitored unit is an equipment, an enclosed space monitored by one or several measurement point(s) (ex.: cold room, heat chamber, building…)
It will be possible to give it a name, an inventory number (optional) and an indicator of «special metrological requirement» if applicable and a schedule of operation if it is not used continuously.
For a monitored unit to exist in JRI MySirius, it must have at least one measurement point.
Archived Monitored Unit
An archived monitored unit is no longer in use in the system. It’s not shown and managed in the MONITORING or ADMINISTRATION tabs. We keep the possibility to see its measurement points configuration and Data in the MAINTENANCE tabs , tile ARCHIVED MONITORED UNITS.
It is possible to put an archived monitored unit back into operation by unarchiving it. Deleting an archived monitored unit erases definitely all data and measurements from the MySirius database .
Temporary Monitored Unit
A temporary monitored unit is a virtual device used to generate and export measurements as part of metrological services such as mapping or calibration.
Measurement point
A measurement point is the region of the monitored unit where the measurements of a physical quantity are performed. One measurement is required to be positioned in a monitored unit. There can be several measurement points in a monitored unit.
In a monitored unit, the measurement point(s) receive all information regarding the configuration: measurement units, recording frequencies, alarm thresholds…
Each measurement will be thus linked to a measuring point.
A measurement point uses a measurement chain to carry out the measurements.
Computed Measurement point
A computed measuring point is the value calculated from 2 measurements obtained from 2 different sensors.
Virtual Measurement point
A virtual measurement point allows the simulation of T° values using the the real measurement point readings. This is done by an algorithm to be specified for each product type.
Measurement chain
A measurement chain is an ensemble consisting of a measuring device (sensor) and a device which interprets the measurements in order to supply useable values for display or recording.
A measurement chain can be composed of a complete device with integrated probe (non changeable) or a device and an external probe connected to it (plug-in or not).
Metrological operations (calibration, adjustment, and verification) are performed on the measurement chains.
A measurement chain must be linked to a measuring point for the measurements to be accepted by JRI MySirius.
Monitored Unit Template
A monitored unit template enables the simultaneous creation of several identical units in terms of:
- the number of measurement points,
- the configuration of these measurement points.
It contains much of the same information as a monitored unit with the following exceptions:
- it is not placed in a zone by default,
- it belongs to no batch,
- it is not linked to one or several measurement chains in particular but to one or more types of measurement chains.
zone
A zone is a geographic localization in which the monitored units can be «physically» placed.
In JRI MySirius, the user can define, as he wishes, the geographical organization of his installed base. To do so, he can create a tree view where each level corresponds to: a site, a building, a level (floor), an area, an office… Each part or subpart of the tree is considered as a zone. It’s possible to add a MAP for each zone.
Each level of the tree view can be named and identified. There’s no limitation in the number of created zones.
Example :
- Domain (JRI),
- Site 1 (Fesches-Le-Châtel)
- Metrology
- RM office
- Laboratory
- Engineering
- Electronic Development Department
- Software Application Development Department
- Metrology
- Site 2 (Bezons)
- Marketing
- Export
- Site 1 (Fesches-Le-Châtel)
User
A user is a person who can connect to JRI MySirius.
A user can only have access to data from the domain belonging to him. He has a profile which lets him know his rights (ex.: the right to add a device, the right to acknowledge an alarm…). His actions are limited by his rights.
Each user has personal data (first and last names, email, telephone number…) and manages his weekly schedule and his lists of alert means (email, sms, voice call) to be used in the event of an alarm. He must fill them out to guarantee the correct functioning JRI MySirius.
A user can have access to a certain number of batches in which are placed the monitored units he wants to see. He can define a home page by default which is displayed at each of his connections. This home page is modifiable in his profile
The user is also assigned to a zone of the geographical organization of the domain which allows direct access to the monitored units which are assigned to him.
Batch
A monitored unit batch is a group of units which enables the organization of the monitoring system. There is no limit on either the number of batches or the number of units per batch.
A batch can contain units from several different zones and a monitored unit can belong to several batches.
Each «Domain» has a default batch named «default batch» which cannot be deleted but which can be renamed.
A monitored unit is required to be in a batch. When a monitored unit is created, it is automatically placed in the batch. It can subsequently be assigned to other batches.
Technical batches
Technical batches serve to group technical devices which are not directly linked to a monitored unit: equipment for communication, relay, alarm…
Threshold alarms
Allowed overrun duration
This concerns the duration of a threshold overrun acceptable by the monitored products before an alarm is triggered. In other software, this notion is also called « Alarm delay ».
Allowed duration of continuous overrun
An alarm with an « allowed duration of continuous overrun » is triggered when the measured value remains above a threshold during the entire defined time duration, without interruption.
The allowed overrun duration is reinitialized if the measured value returns to normal before the end of the countdown.
- The allowed overrun duration (delay) is a multiple of the measurement frequency of the measurement point.
Allowed cumulative overrun duration
An alarm with a « cumulative overrun duration » is triggered when the sum of the different overrun durations for a given threshold exceeds the defined time duration over a given recording period (sliding period):
Ex: Authorized overrun duration = 1h over a 24h period.
The alarm will be triggered when the measurement point exceeds the threshold for more than 1h (by a single occurrence or « x » occurrences) over the past 24 hours.
- The authorized overrun duration is set by default to be continuous; if a cumulative duration is desired, this must be specified.
- A maximum duration of taking in charge (sliding period of cumulative threshold overruns, example: 1 hour of overrun over 24h, 1 week…)
MKT Threshold
An MKT overrun alarm is triggered when the MKT calculated over a sliding period defined by the user exceeds the defined threshold value.
Threshold criticality
For each threshold, the user can define whether or not it is critical. This allows the differentiation between critical and noncritical thresholds for the notification of the different persons in the management of the alerts.
Technical alarms
A technical alarm is an alarm which involves the equipment, as opposed to threshold alarms which apply to performed measurements.
Among the technical alarms are those related to the state of the battery, a sensor problem, a communication problem… but also other alarm types such as metrological or maintenance alarms.
- Battery alarm: The energy level of the device batteries is continuously monitored by JRI MySirius. As soon as the value passes below 40% remaining energy, the device enters the technical alarm and flashes blue. The treatment of the technical alarm is then managed by JRI MySirius.
Sensor error: The devices are capable of detecting the integrity of their sensor(s). If they detect an error, they send a technical alarm message to JRI MySirius which triggers a technical alarm and displays it on the screen (see technical alarm management
Sensor error: The devices are capable of detecting the integrity of their sensor(s). If an error is detected, they will send a technical alarm message to JRI MySirius which triggers a technical alarm and displays it on the screen (see Alarm Management)
Communication error : Communication errors are managed and detected by JRI MySirius, which detects an absence of received data. Activation allows notification when this situation occurs, providing assurance that all the measurements are correctly transmitted. To activate (see General preferences)
Time zones
The timestamp of the measurements is dependant of the time zone defined at the creation of the customer account. whatever the country from which the user desires to view the measurements.
Ex: if a customer from Paris views his data from New York, the dates and times will be those of Paris.
Tutorials
To help you to configure your monitoring system, MySirius offers different tutorials that will guide you step by step through all the configuration steps.
To run a tutorial, click the  button on the “Administration” tab.
Then click on the item ** “Tutorial” ** of the section ** “Assistants” **
Choose the tutorial from the list and let MySirius guide you.
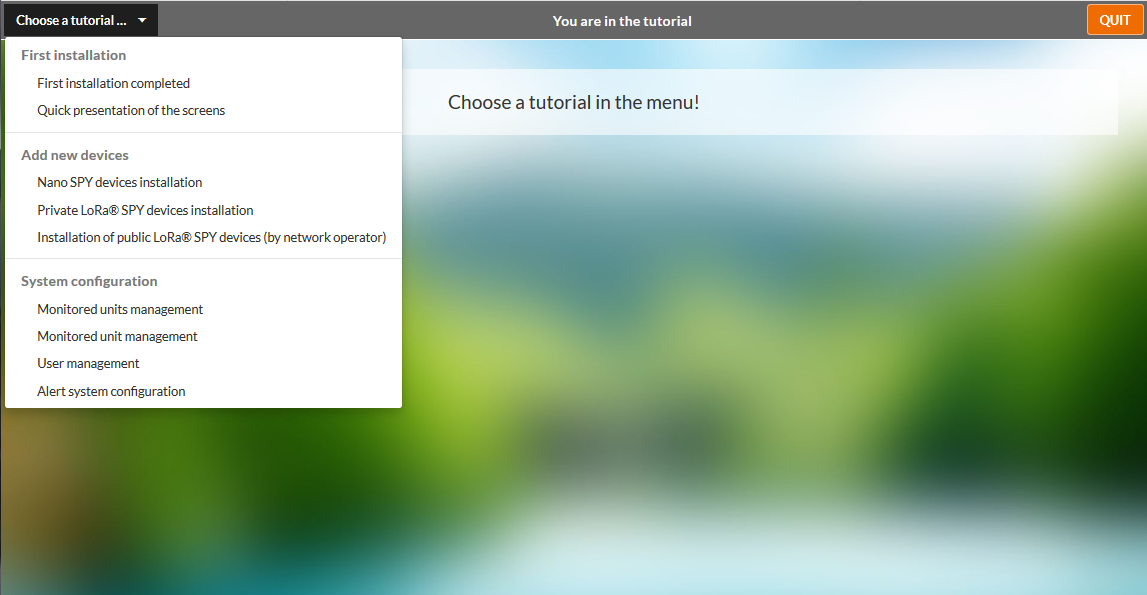
The windows that are displayed are directly related to the chosen tutorial and the instructions are given using popups.
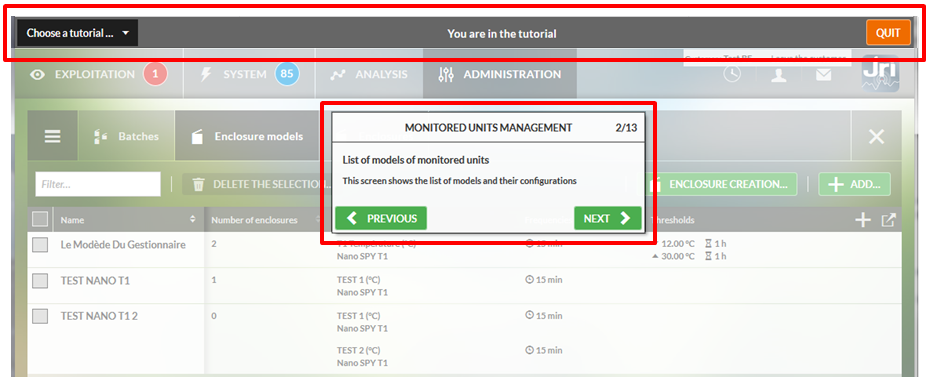
- The top banner tells you that you are following a tutorial, that you can leave it or change it.
- All the actions that you carried out until validation or registration are taken into account by MySirius.
Profil customization
To customize your profile see User account management
Administrator subscription section
The administrator can choose whether or not to receive JRI communications on the following subjects:
- ADMINISTRATIVE
- Contracts
- Billing
- METROLOGICAL
- Certificate management
- Recurring services or on metrology sites
- TECHNIQUE / EXPERT
- Distribution of technical information
- Intervention
- Software updates
- Remaining sms/call
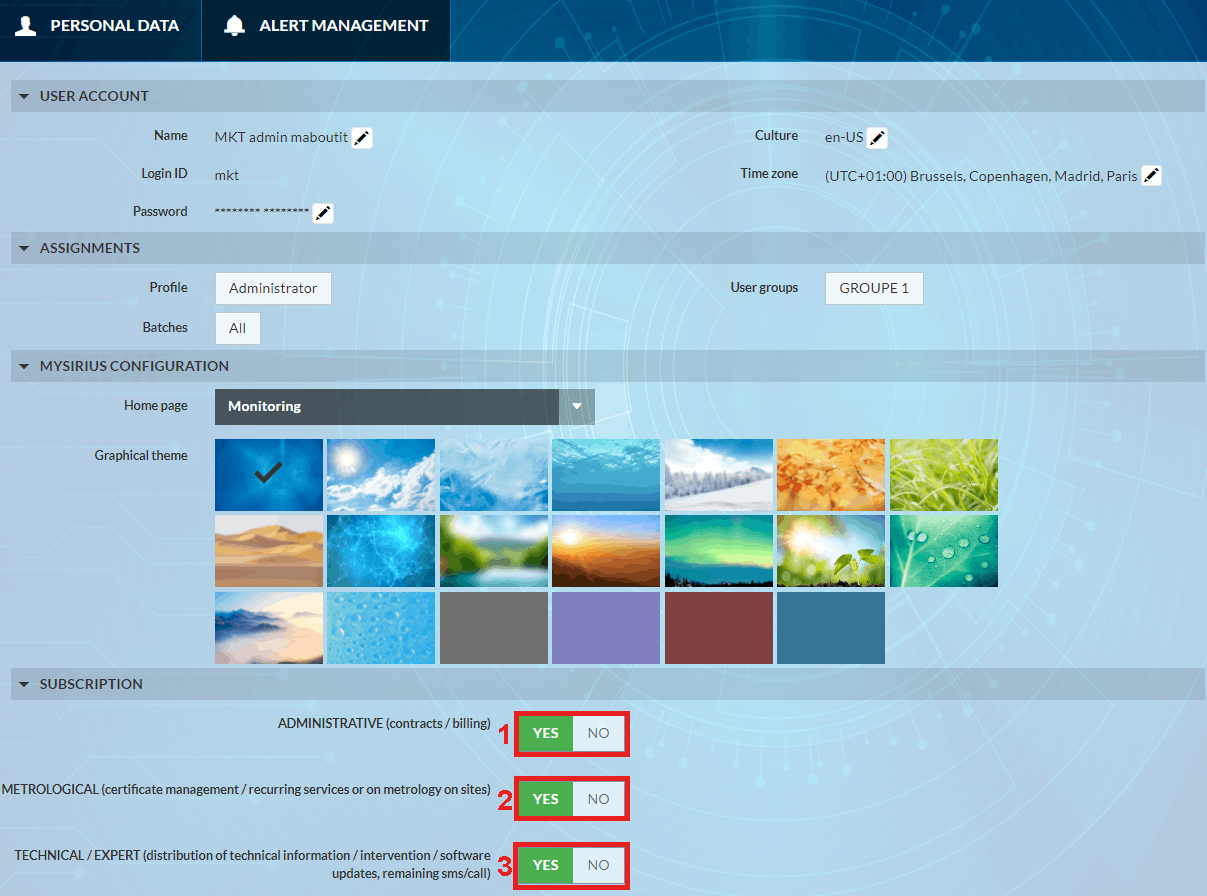
Please note that the Subscription feature is only available to users with a MySirius CLOUD subscription. # Equipment declaration
Gateways
Gateway refers to the communication devices in JRI MySirius. These devices are used to transfer data from Nova SPY or Nano SPY or LoRa® SPY (connected probes) to JRI MySirius. For the Nova SPY & Nano SPY, the gateway is called Nano SPY LINK and must be installed first to allow detection of the Nova SPY & Nano SPY devices .
There are 2 types:
- Nano SPY LINK Ethernet
- Nano SPY LINK WiFi
For the LoRa SPYs communication with MySirius, we use JRI LoRa Gateways.
Nano SPY LINK Ethernet
Ethernet version:
- Provide an Ethernet socket on an ADSL access point or on a company network located lass than 3 meters from the Nano SPY LINK.
- Provide also a mains outlet less than 3m from the Nano SPY LINK if this is not at POE version.
- Make certain that the port 13251 is open on your router (refer to the instructions for your ADSL box for its configuration) or verify with your IT service.
- The network must be programmed in DHCP and accept DNS requests.
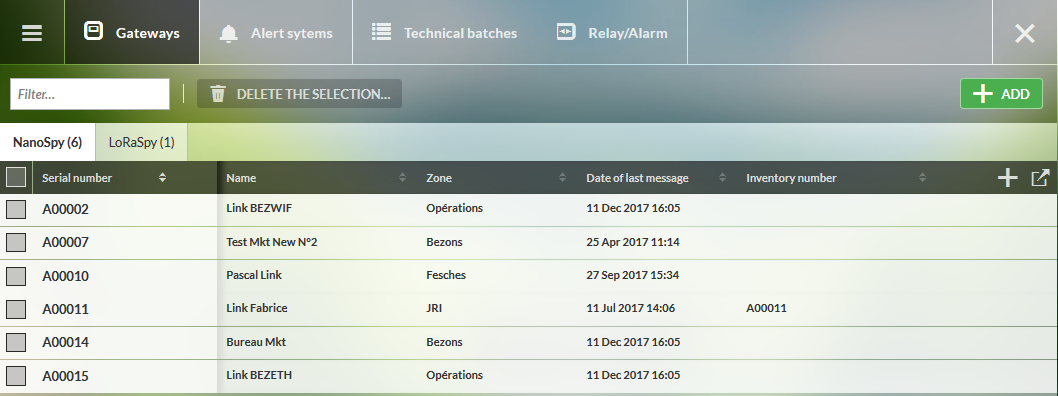
- Open JRI MySirius and select the “Administration” pane.
- Click on the Gateways tile.
The list of installed Nano SPY LINK devices is displayed. For a first installation it will be empty.
- Click on

- Then fill in the fields of the dialog box which opens. Click “Save” when finished
If all has gone well, the Nano SPY LINK declared will appear in the list
- Put in place and connect the Nano SPY LINK. If the installation takes place correctly, the indicator lights ‘’Network’’ et ‘’Cloud’’ come on indicating that the Nano SPY LINK is connected to JRI MySirius.
If the “Cloud” indicator light of the Nano SPY LINK does not turn on:
- verify that the port 13251 is indeed open,
- connect the Nano SPY LINK to the network as well as to the USB socket of the PC (see: Nano SPY LINK instructions), 3 download and install the application « Network ConfigLink » from the site : http://www.jri.fr then follow the instructions,
- verify the network addresses. If needed put the Nano SPY LINK as fixed IP address if your network is not in DHCP then enter the addresses.
When finished, the ‘Network’ and ‘Cloud’ indicator lights come on to show that the SPY LINK is connected to JRI MySirius. Put it back in place.
Nano SPY LINK WiFi
- Provide also a mains outlet less than 3m from the Nano SPY LINK if this is not at POE version.
- Make certain that the port 13251 is open on your router (refer to the instructions for your ADSL box for its configuration) or verify with your IT service.
- The network must be programmed in DHCP and accept DNS requests.
At reception, the Nano SPY LINK contains no connection information (SSID and password):
- connect the Nano SPY LINK to a PC using a maintenance USB socket,
- run the dedicated software program to enter the WiFi parameters.
Once the parameters are entered, the Nano SPY LINK is operational.
Any modification of the WiFi router parameters will require performing the following actions.
Configuration
- Download and install the application « ConfigLink Network » from: http://www.jri.fr
- Run the application « ConfigLink Network.exe »
Once the Nano SPY LINK is connected to the PC, start the application and follow the indications on the screen:
- Select the com port to which it is connected and load its configuration. When the Nano SPY LINK is recognized, its image appears. Click on configuration
- enter the SSID,
- enter the password,
- save the parameters,
- restart the Nano SPY LINK.
At this moment, the Nano SPY LINK will restart and try to connect to the WiFi network. The indicator lights “Network” and “Cloud” lit indicate that the Nano SPY LINK is connected to JRI MySirius.
You can verify the correct declaration of the Nano SPY LINKs in the “Administration” pane of JRI MySirius
The « Gateways » tile of the “Administration” dashboard allows you to know the number of Nano SPY LINKs installed. By clicking on it you can edit the list to verify the serial numbers.
For that which concerns the physical installation, refer to the user manual of the Nano SPY LINK.
LoRa Gateways
The LoRa Gateway ensure the communication between LoRa SPYs or LoRa TEMP’ probes and MySirius platform.
There is 2 types :
- Public Network LoRa Gateway : declared by default bt JRI on a configuration with public LoRa network subscription.
- Private LoRa Gateway (4G or Ethernet): You have to add it manually from the ADMINISTRATION section, click on GATEWAYS then select ADD.
You have to select GATEWAY LORA SPY and key in all the required information (Serial number, name …)
Alert and relaying devices
Nano SPY ALARM
The Nano SPY ALARM has two functions:
- Acts as a relay in the transmission of the measurements between the Nova SPY or the Nano SPY and the Nano SPY LINK
- Acts as a local alert device in the event of an alarm.
Once the Nano SPY LINKs are declared and installed, the Nano SPY ALARMs are detected and added automatically.
LoRa SPY Alarm
LoRa SPY Alarms act as a local alert device in the event of an alarm on one of the devices in the LoRa range. They transmit alerts visually from LoRa SPY and LoRa Temp’ devices.
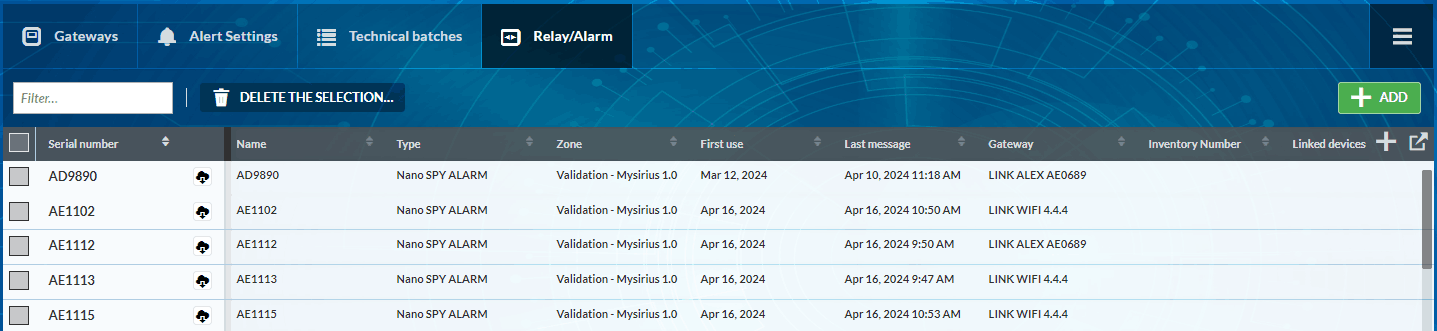
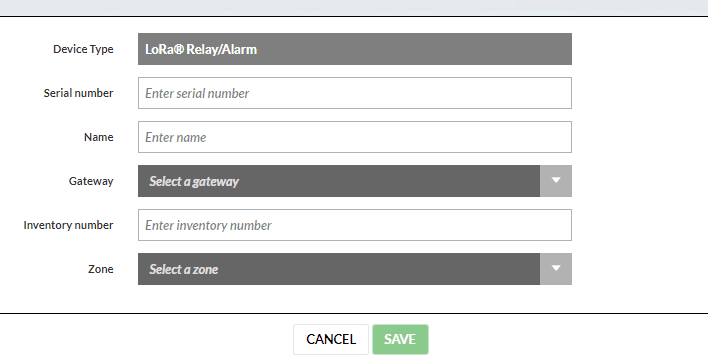
You need to declare it manually from the ADMINISTRATION tab, click on RELAY/ALARM and then ADD.
Then select the LoRa Relay/Alarm type and fill in all the required fields.
Wireless probes and recorders
Nova SPY & Nano SPY
To add a Nova SPY or a Nano SPY in MySirius, insert a battery and switch it on (see Nova SPY or Nano SPY user manual).The detected Nova SPY’s or Nano SPYs are displayed in the “Administration” tab in the “Installation” indicator:
As long as the devices are in waiting state, they cannot be used to monitor a monitored unit. To finalize the declaration and render them usable of monitoring, click on the number of waiting devices.
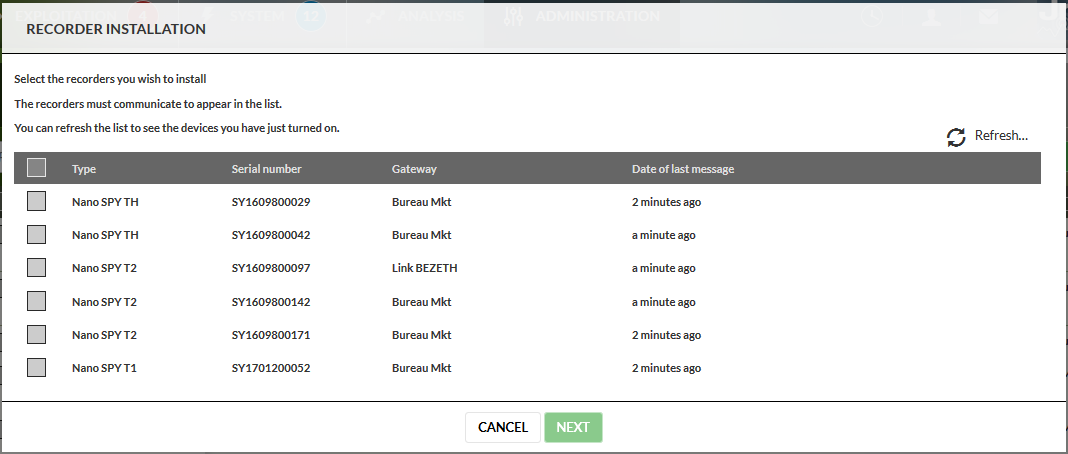
Select the devices for which you want to finish the installation then click on “Next”.
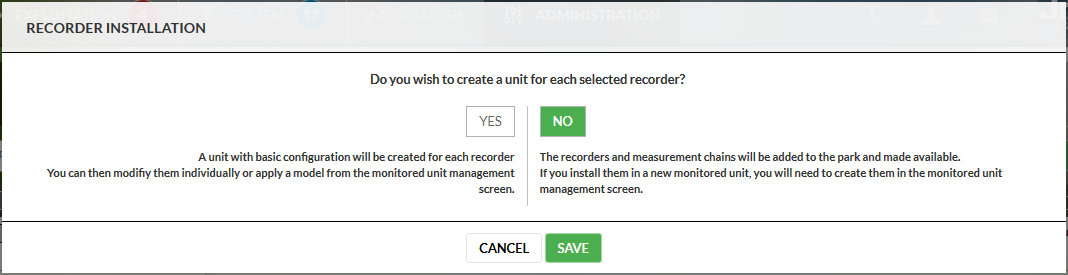
You now have the choice whether or not to create a monitored unit.
- If you choose “NO”, the recorder will add to the list of available devices which will be proposed for the creation of units (see creating a monitored unit).
- If you choose “YESI”, JRI MySirius will directly create the monitored units. It will then be necessary to configure them (see unit configuration)
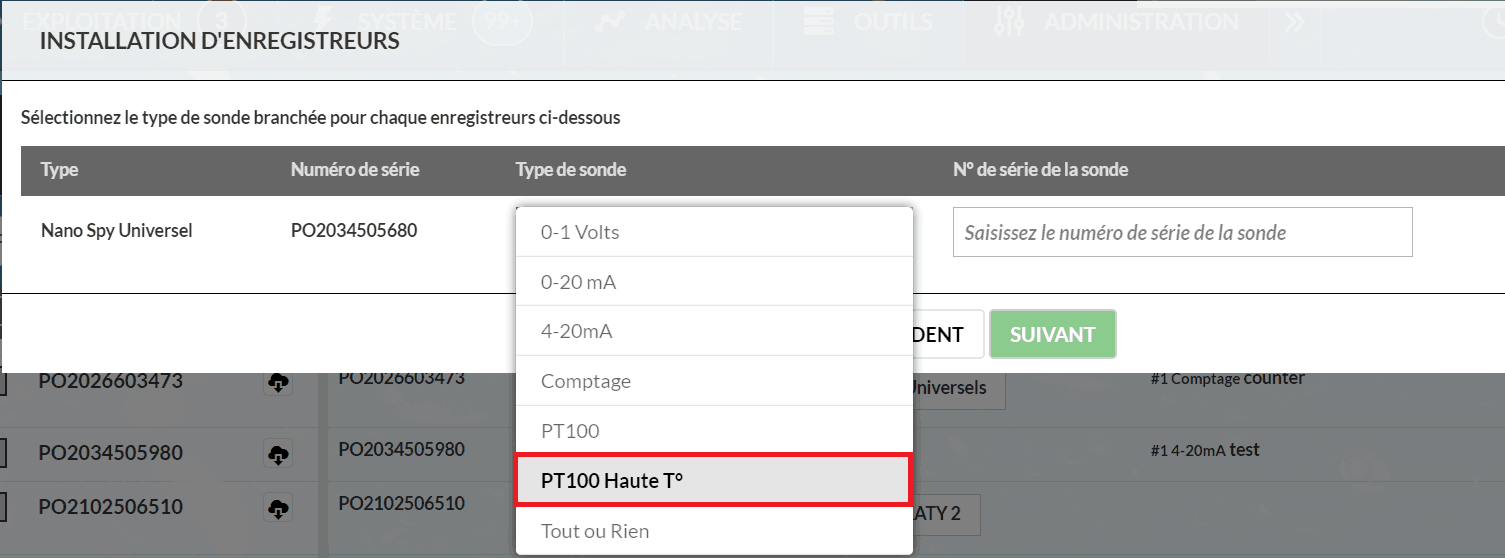
Nano SPY Universal
For Nano SPY U, you must specify the type of sensor (analog input) connected to the device. (0-1V, 4-20mA, On/Off …)
** From version 4.0 of the Nano SPY**, it is possible to declare PT100 High T° probes (300°/700°C).
PREFERRED NANO LINK / RELAY configuration (Dynamic/static radio communication)
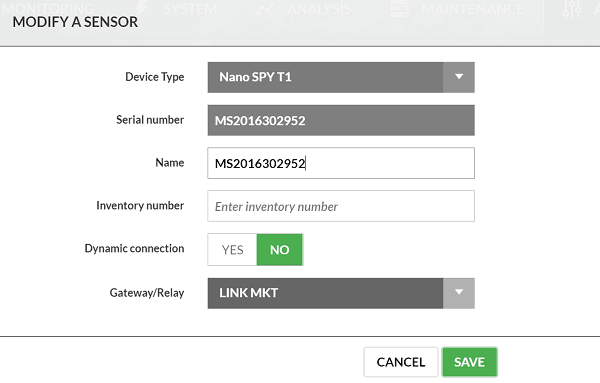
By default,when you activate a Nova SPY or a Nano SPY, it communicates automatically with the available LINK or RELAY. It is possible to “force” a Nova SPY or a Nano SPY to communicate with a preferred LINK or a RELAY. In ADMINISTRATION tab, RECORDERS tile, click on the serial number of a device then select NO for dynamic connection. Choose a LINK or RELAY from the list and SAVE. If the preferred LINK / RELAY does not respond, the Nova or Nano will automatically switch to other available LINKS or RELAYS.
LoRa® SPY & LoRa® Temp’
- The LoRa® SPY and LoRa® Temp’ devices used on public LoRa network (Orange; Objenious) do not self-declare; declaration must be performed manually after provisionning the devices on the provider’s platforms (Spot or Live Objects).
For this click on “Administration”, select the “Recorder” indicator then “Add a recorder manually”.
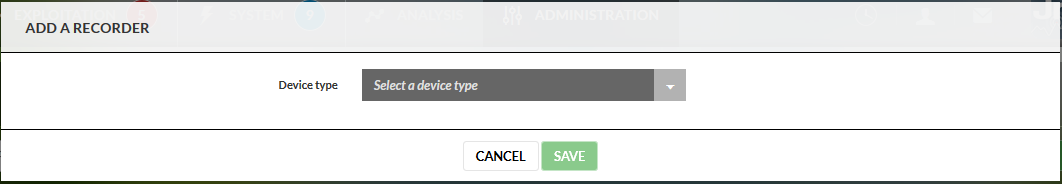
Follow the instructions to finish the declaration.
- The LoRa® SPY and LoRa® Temp’ devices used with private LoRa Gateways are self-declared after activation; they’re detected by the closest Gateway and added automatically in the list of Self-declared devices in MySirius.
SPY RF
The SPY RF devices can be imported from an existing SIRIUS STORAGE installation through the ACCESS POINT tool. See more configuration details on the ACCESS POINT procedure.
Choice of a PREFERENTIAL LINK or RELAY
By default, the choice of radio paths on the NANO range is done dynamically. When a NANO SPY is activated, it connects to the available LINK or RELAY. It is possible to “force” a NANO SPY to communicate preferably with a LINK or a RELAY. In ADMINISTRATION / RECORDERS, click on the serial number of a device and select NO for the dynamic connection. Choose a LINK or RELAY from the list and SAVE. If the preferred LINK / RELAY does not respond, the NANO SPY will automatically switch to other available LINKS or RELAYS.
Monitored Unit creation
Following declaration of the probes, the monitored units must be declared. The monitored units will be associated with the measuring points automatically created during the declaration of the recorders to allow visualization of the variations in the monitored quantity.
To create a monitored unit, click on the “Units” indicator on the dashboard of the “Administration” page
Or else via the menu  from any open page in “Administration”.
Then click on
JRI MySirius will propose:
- either to create a monitored unit from a model,
- or to create a monitored unit starting from a new unit.
Creation starting from a new unit
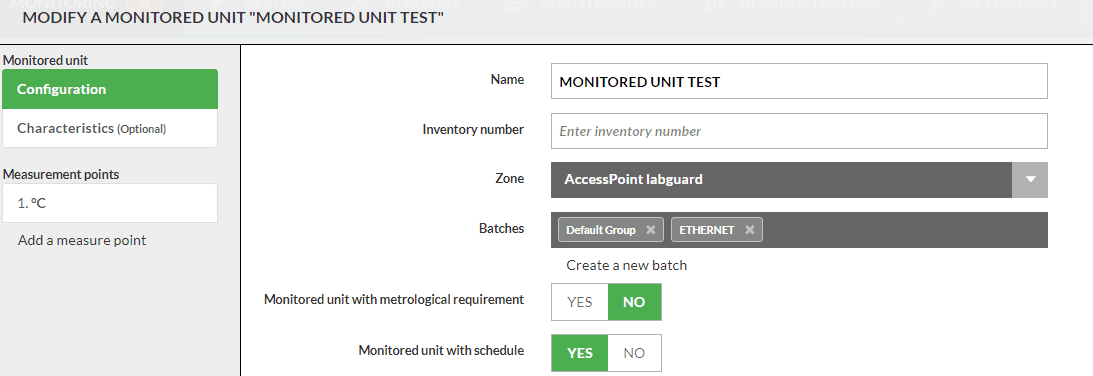
Clicking on this choice opens the window “Add a monitored unit”. Fill in the required fields of the 2 sections:
CONFIGURATION:
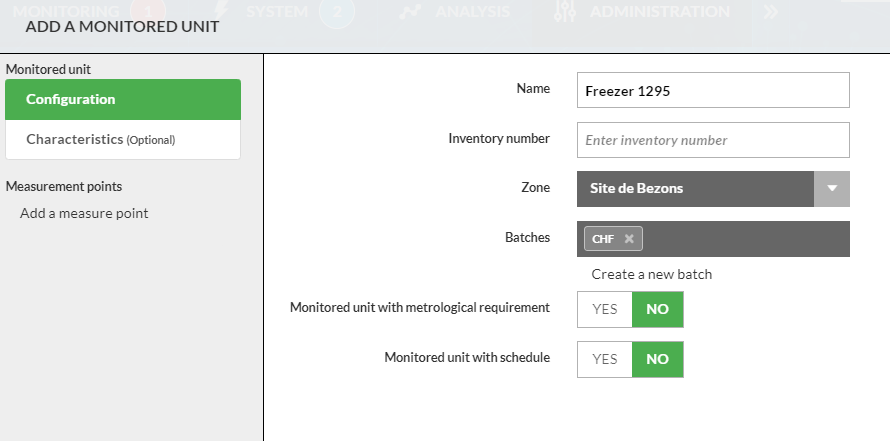
- Nom : This field is required. If it is not filled in, i twill not be possible to continue the monitored unit creation
- Inventory no. : Field not obligatory. This will depend on the management of the material put in place.
- Zone : Field not obligatory. This field enables the positioning of the monitored unit in a geographical zone of the installation. If no geographical organization has been defined, the monitored unit will be placed in the default zone.
- Batches : Field not obligatory. This field enables the grouping of the monitored units into batches. If no organization by batch has been defined, the monitored unit will be placed in the default batch. If no batch exists or if the batch in which the monitored unit most be placed does not exist, click on “Create a new batch…” (see batch creation).
- Metrological requirement : Characterize your unit by indicating whether or not it is subject to metrological requirements. This information enables the management of indicators and alerts on the metrological services.
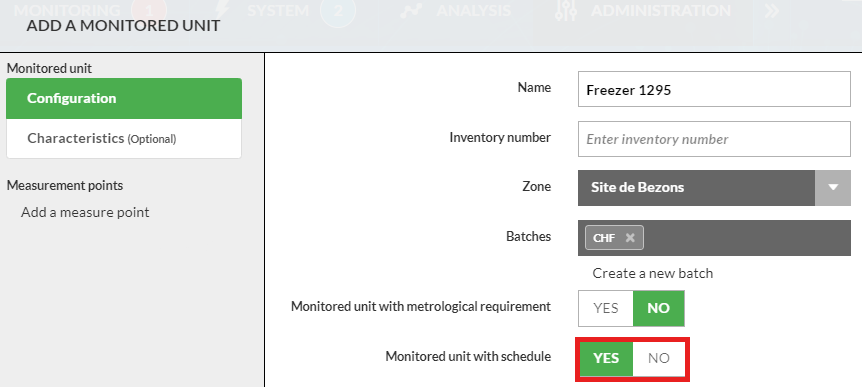
- Operating schedule : This information is important if you use monitored units that do not operate continuously. This allows you to avoid monitoring and managing alerts or to manage them according to different thresholds during certain periods. to set an operating or function schedule :
- Open the configuration menu of a monitored unit, and select YES for the parameter “MONITORED UNIT WITH SCHEDULE”.
- Customise the weekly schedule displayed. It is possible to divide a day into several time slots using the sliders 🔻
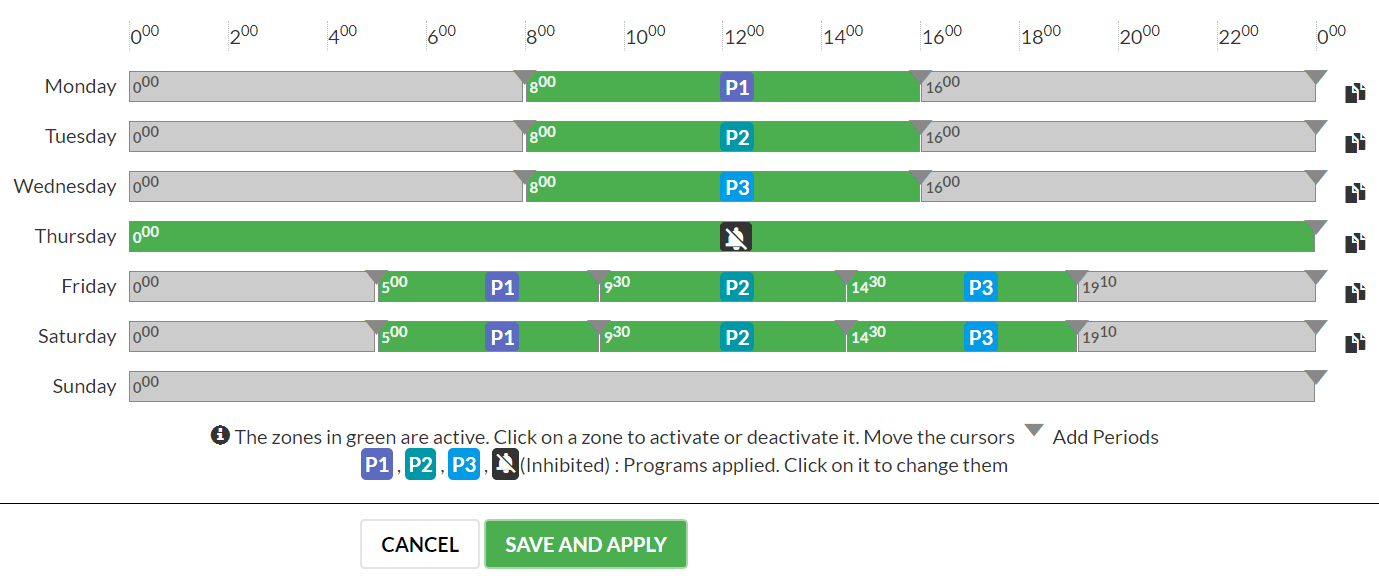
- Enable/disable the recording of values on a zone by clicking on it
- Grey zones = No recording of values and no alerts triggered (thresholds / technical alerts)
- Green zones = Recording of values with management of alerts
- Zones with programs P1, P2, P3 = Triggering of alarms according to the thresholds and delays defined in each program
- Zones with alarm inhibition = Inhibition of alarms.
- Set the alert programs (criticality, thresholds, time delay, etc.) for each measurement point
CHARACTERISTICS:
This information is optionnal and shown in the monitored unit details.
- Type
- Manufacturer name
- Manufacturer reference
- Manufacturer serial number
- width (m)
- Height (m)
- Depth (m)
- Picture: A picture of the monitored unit can be added for an easier identification. It can also be a picture of the measurement point (s) location in the moniored unit. It is recommended to use JPEG or PNG files (50 Kb max).
Add measurement points:
Click on “Add a measurement point” the measurement point appears under the monitored unit name.
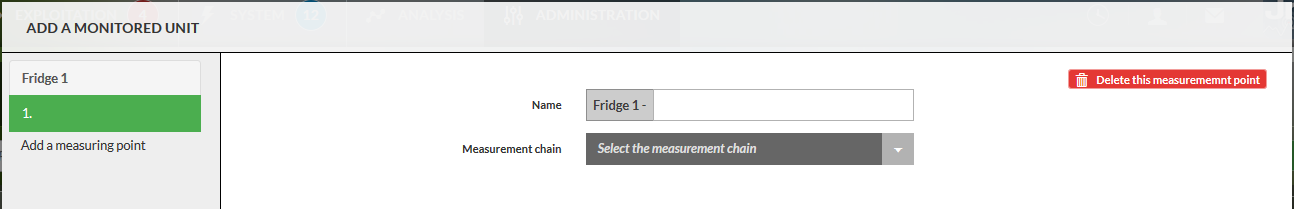
- Name : identification of the measurement point.
- Measurement chain : Select the measurement chain from the list proposed by JRI MySirius. Depending on the type of measurement chain selected JRI MySirius displays the configurable parameters.
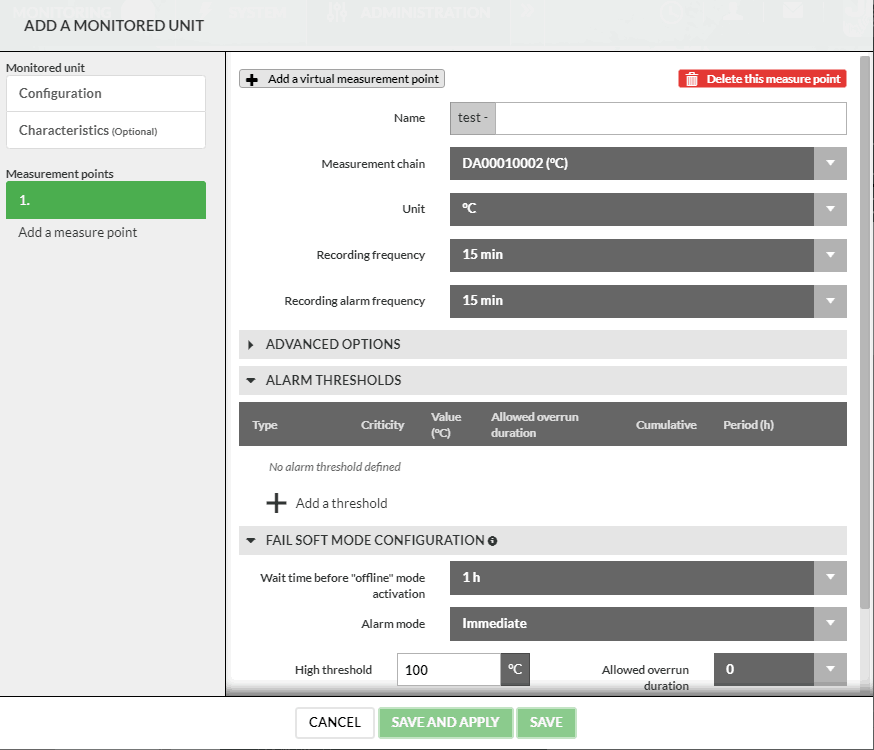
- Unit : Choose the measurement unit of the measured quantity from those proposed by JRI MySirius.
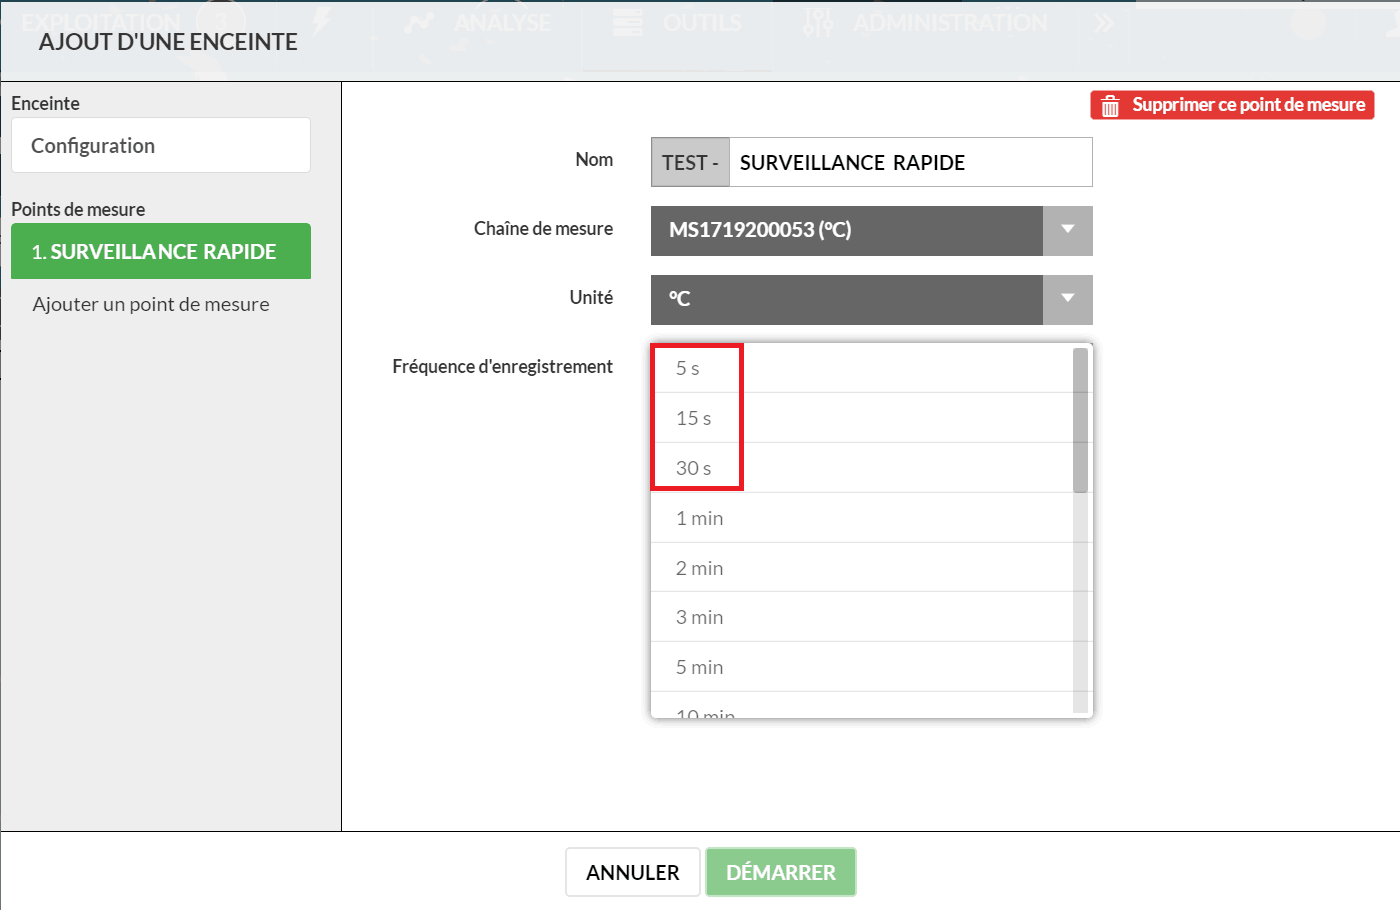
- Recording frequency : Depending on the type of measurement chain, i twill be possible to choose two recording frequencies : on for “normal” operation when all is going well, and another higher frequency when an alarm is triggered and until acknowledgement.
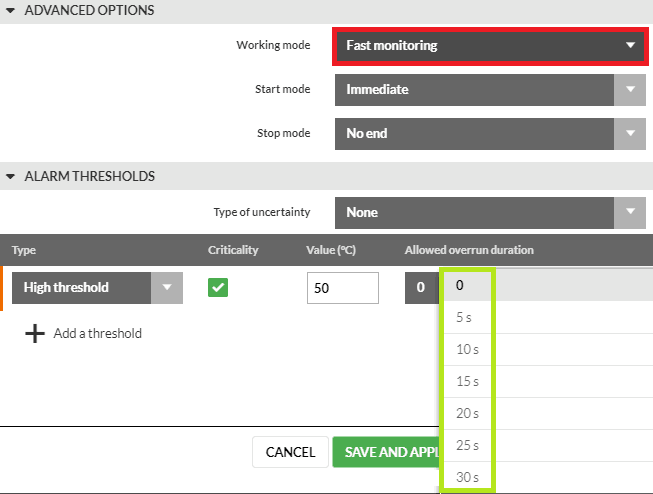
- Display advanced options: Contents adapted according to the type of measurement chain used.
- Standard mode (Nova SPY & Nano SPY): Measurement + transmission every minute. Recording and triggering of alerts according to the threshold settings.
- Fast monitoring mode (All version of Nova SPY & Nano SPY from V4.0): Measurements up to 5 seconds for quick detection of a threshold violation. Transmission every minute and recording in 1 minute minimum.
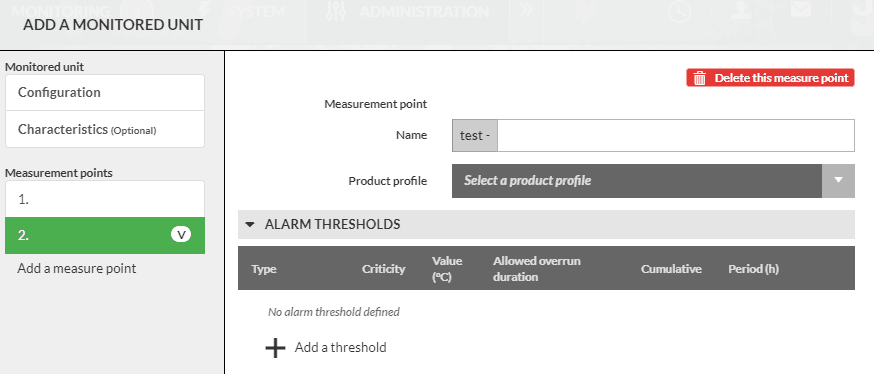
* ** Start/Stop**: The choices offered by My Sirius depend on the type of measurement chain.- Alarm thresholds : Click on
 to add an alarm threshold.
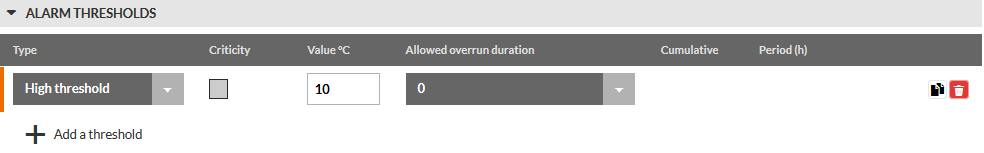
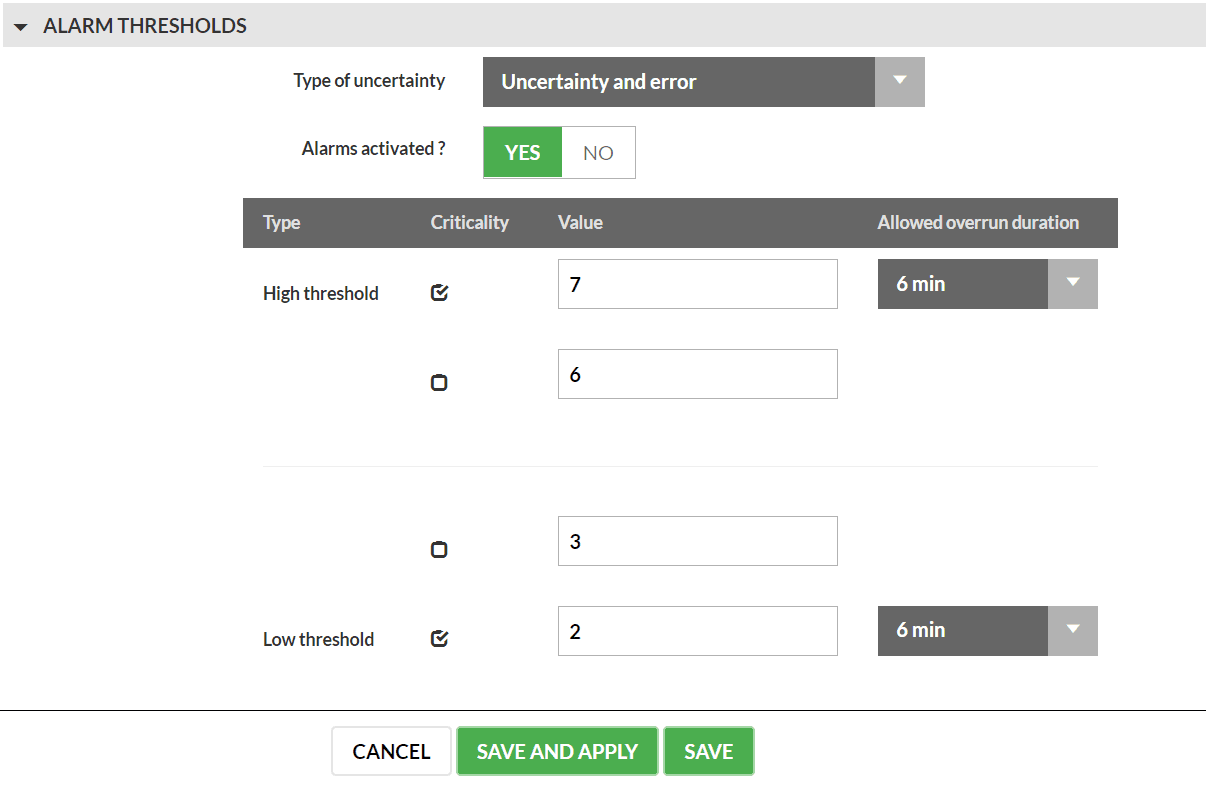
- Choose the type of threshold (High, Low or on MKT)
- Indicate whether or not it is critical. This information allows qualification of the nature of the monitored unit and/or its contents as well as notification of specific persons in the event of an alarm.
- Enter the threshold value.
- Select the authorized duration of overrun from the list proposed by JRI MySirius.
- A checkbox appears in the column “Cumulative?”
- Do not check the box if you wish for the overrun duration to be continuous before triggering an alert.
- Check the box if wish to trigger the alert following a succession of overruns.
- If you have checked the box “Cumulative?” define over what period of time you wish to monitor the successive overruns. This period is sliding and is reinitialized automatically when an alarm is triggered. Example :
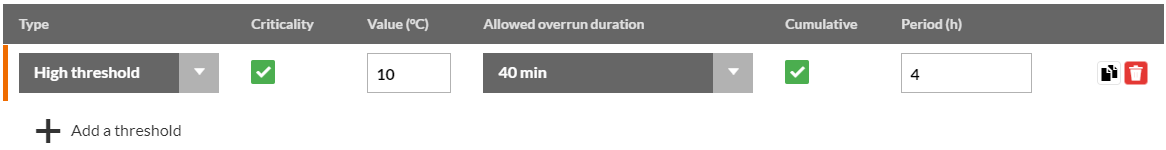
High threshold / Value = +10°C / Duration of authorized overrun = 10 minutes / Cumulative over 4h. The alert will be triggered when the temperature will have exceeded the threshold for 10 minutes in one or several occurrences during the last 4 sliding hours. The duration of the period is automatically reinitialized after the triggering of an alarm.
- Click on
 to add a threshold with the same parameters.
Depending on the type of measurement chain, i twill be possible to manage up to 4 alarm thresholds.
- The “Non connected” mode is available only for the Nova SPY & Nano SPY. This mode is provided so that the Nova SPY or the Nano SPY that lose communication with JRI MySirius can detect threshold alarms. In normal operation, the Nova SPY or the Nano SPY sends its measurements once per minute to JRI MySirius which manages the thresholds and the recording of the measurements.
- Waiting time before activation of “offline” mode. This is the time at the end of which the Nova SPY or Nano SPY itself detects its alarms and manages the color of its status LED if does not receive a return acknowledgement of the transmission of its measurements. It memorizes the information and transmits it as soon as communication is re-established.
- Alarm mode : select from the 3 choices proposed by JRI MySirius * Maintained signifies that the Nova SPY or the Nano SPY will remain in alarm (red LED lit) even if the T° returns within the thresholds
- Immediate signifies that the Nova SPY or Nano SPY follows the temperature values. It will be red if the temperature exceeds the thresholds and return to green as soon as the temperature returns within the thresholds.
- No alarm management
Click on the button to duplicate the thresholds and authorized durations of overruns already entered in “alarm thresholds” or else fill in the fields if these values are different.
The thresholds are duplicated according to:
- their number: if there is only a high threshold and a low threshold, the two thresholds will be duplicated. If there are four, the lower high pre threshold and the highest low pre threshold will be duplicated (eg HTh = 30 and 25 and LTh = 10 and 5, the duplicate thresholds will be 25 and 10. Other example : BTh = 30, 25 and 20 and LTh = 5 then the thresholds 20 and 5 will be duplicated)
- their criticality: if you have critical and non-critical thresholds, the critical thresholds will be duplicated according to the rule above.
If you want to add another measurement point, click on “Add a measurement point », otherwise click on “Save and Apply” or on “Save” to validate the creation of the monitored unit.
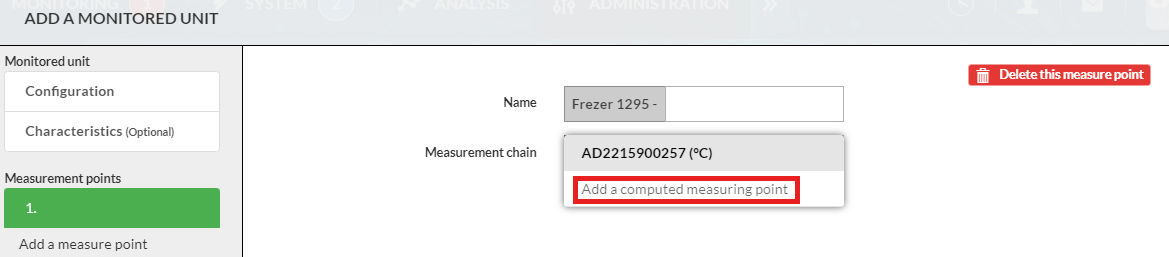
- Virtual measurement point It’s possible to add a virtual measurement point to simulate a “CORE TEMPERATURE” of a product using a specific algorithm (Product Profile). Once a measurement point is created, click on the button
 and fill in the fields of the following page :
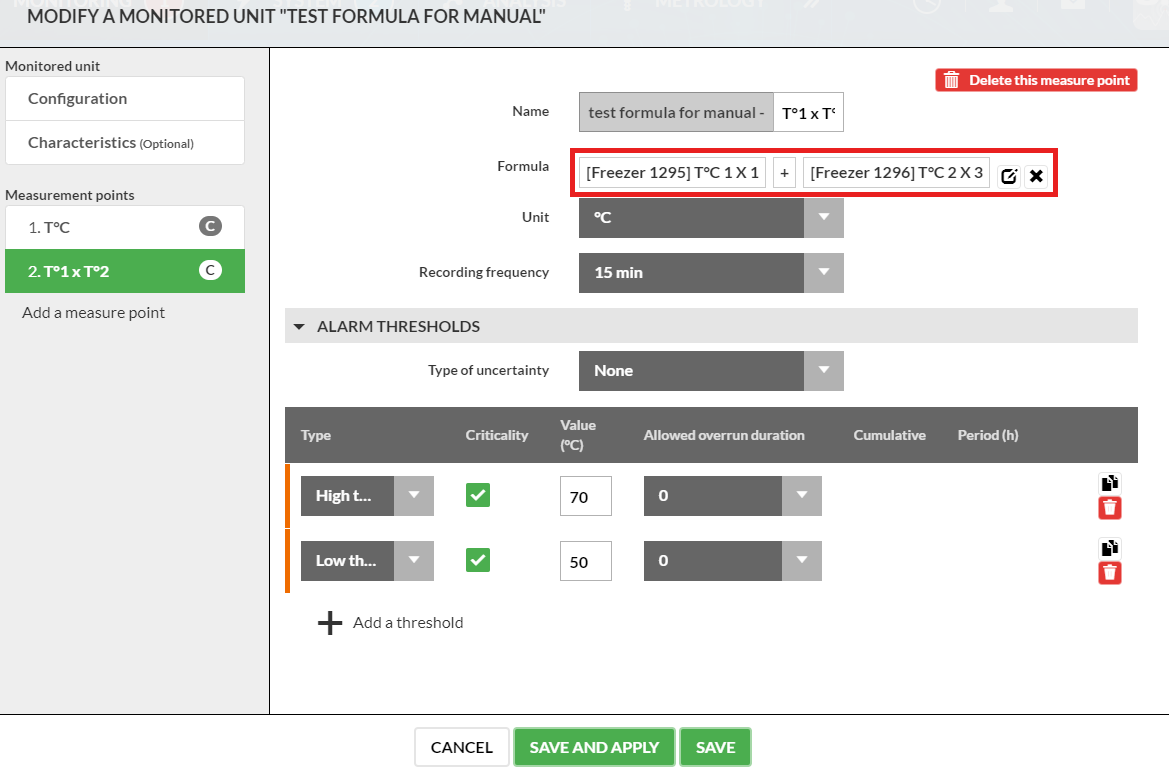
- Computed measuring point: It is possible to add a calculated measurement point to display a value calculated from 2 measurements from 2 different sensors. To create a calculated measurement point, select “Create a computed measurement point” from the list of measurement chains.
The following configuration page is used to enter the name, formula, unit, recording frequency and thresholds for the computed measuring point:
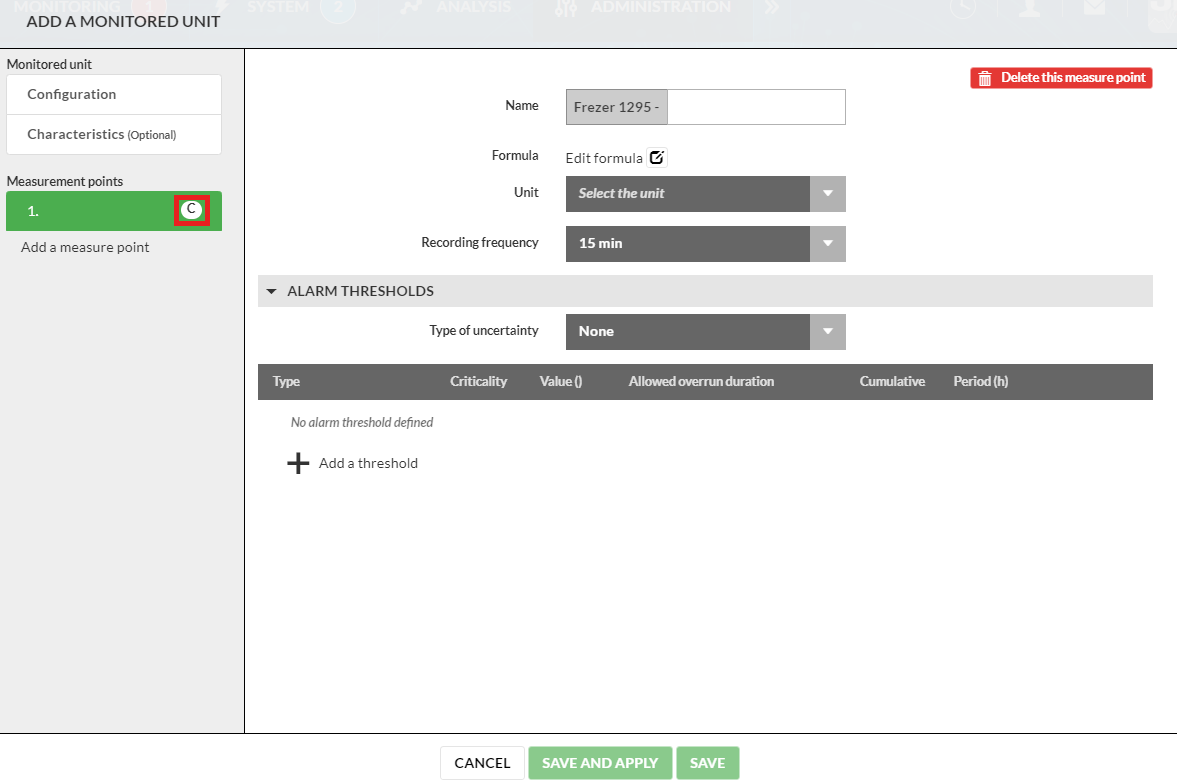
*** Define the calculation formula:*** To define the calculation formula, click on  .
.
Two possible cases are possible: * Calculation between a numerical coefficient or offset and the value of a measuring point * Define the desired coefficient or offset, then the operation and the measuring point concerned. * Several operations are possible: add, subtract, multiply, divide or average.
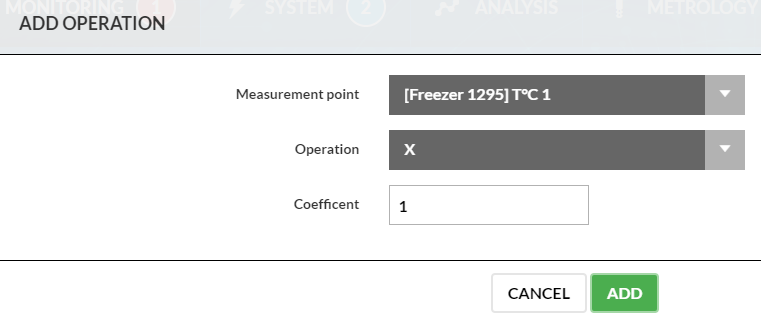
- Calculation between two measuring points
- On the configuration page, click on

- Define your first computed measurement point
- Define the operation linking the two measurement points, the coefficient or offset of the second point and the second measurement point.
- On the configuration page, click on
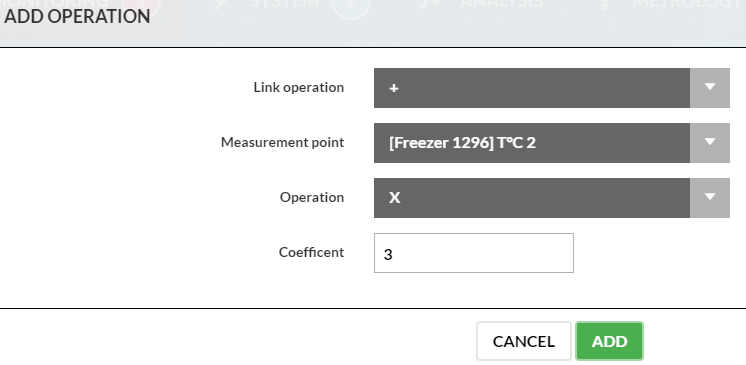
The formula is then displayed on the computed point configuration page.
** “Save and Apply”** saves and sends the configuration to the device.
" Save" allows saving only, deferring to the end of the installation the sending of the configuration.
Unit creation from a Template
Monitored units can be created using configuration templates. Once a tetmplate is chosen, the window displays the 1st unit which will be created on this model with the number of measurement points and the type of measurement chain defined in the template.
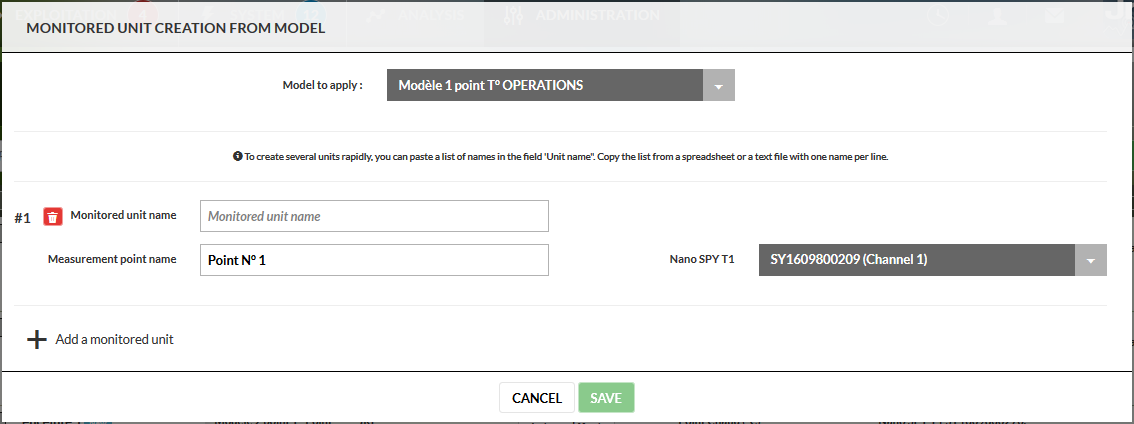
- Fill in the fields “Unit name” and “Measurement point name”
- The field corresponding to the measurement point will be pre-filled if JRI MySirius has the devices corresponding to the measurement point defined in the template. It will then be possible to choose from the list proposed by JRI MySirius. If it is empty this means that no corresponding device is available.
- Everything related to the configuration of the measurement points: Thresholds, authorized duration of overrun, recording frequency … is defined in the model.
Creation of multiple units
To add one or several units on a template, copy then paste a liste of the monitored units from an Excel sheet in the “Unit name” field.
Creation of a monitored unit Template
A monitored unit template is a configuration type allowing the creation of several identical units at once. To create a monitored unit from a template, it is necessary to create the templates first.
Click on the indicator “Monitored Unit templates” on the dashboard of the “Administration” page.
Or else via the menu from any open page in “Administration”.
Then click on the “Monitored Unit template” tab. The list of existing models opens.
Click on to add a template.
The process is identical to the creation of a monitored unit except that one must choose the measurement point type rather than the measuring point.
Batch creation
Batches allow the grouping of units according to different criteria which are specific to each organization: Monitored quantity, domain of activity, stored products…
To create batches, click on the “Units” indicator on the dashboard of the “Administration” page
Then click on the “Batches” tab. It is also possible to do this via the menu from any open page in “Administration”.
The list of existing batches opens
- Click on
- Name the batch that you wish to create.
- Choose if you wish to manage the communication error alarms for the monitored units of this batch by selecting a triggering delay time from the list proposed by par JRI MySirius.
- Finally select the monitored units that you wish to include in this batch.
- Click on “SAVE” to confirm the creation of the batch.
Alert creation
Alerts are the means implemented by JRI MySirius to notify the users if there’s an alarm. These can be of various types:
- SMS
- Voice calls to fixed-line or mobile telephones
- Material
- Light bar on Nano SPY LINK and ALARM
- Buzzer on Nano SPY LINK and ALARM
- Relay output on Nano SPY LINK and ALARM
In JRI MySirius, the alerts are triggered using a single mean, or in escalation using multiple means one after the other.
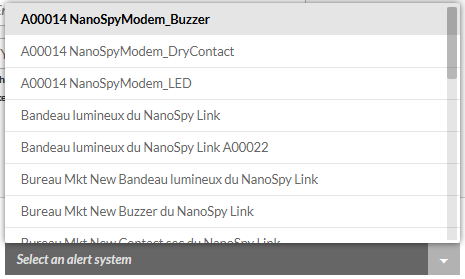
To configure the alerts click on  from “Administration” then on Wizards then Alert system
This wizard will guide you step by step to create your alerts.
A window opens giving you two choices to configure your alert system
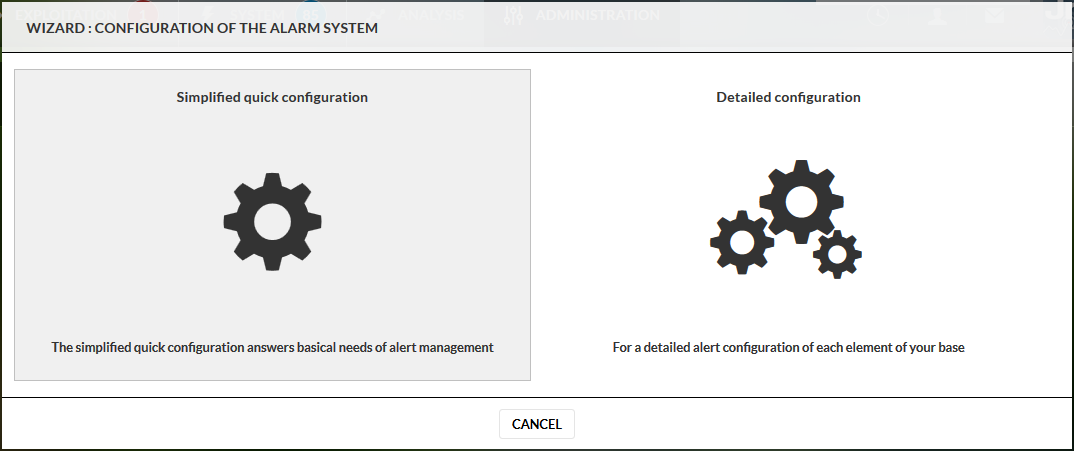
- a fast and simple configuration
- a more detailed configuration
Simplified and fast configuration
The simplified configuration of the alerts allows you to choose the person or persons to warn and also to activate alert means. These alerts are all executed simultaneously without delay. Click on this option and follow all the steps of this tutorial to perform a quick and simplified configuration of alerts to be made in case of alarm
Detailed configuration of an Alert escalation
This configuration allows you to send alerts to groups of people and to activate alerting devices in escalation. Clicking on this option opens a window asking you to choose what you want to define your alerts on:
This wizard will guide you step-by-step to create your alerts.
A 1st window opens to request that you choose on what you wish to define your alerts:
- A monitored unit batch
- A single unit
- A technical batch
- The free recorders (which are not assigned to a monitored unit but are functioning)
Once your choice is made, click on next
- A second window opens listing the types of defaults for which you can define an escalation
- Choose “create a new alert escalation” in the selection list of the chosen fault type
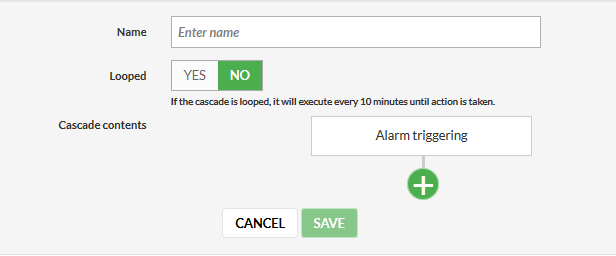
- Name : Enter a name for the escalation to be created
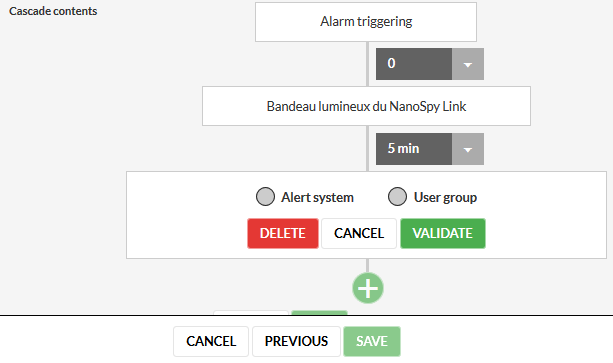
- Repeated in loop : This function enables automatic restarting of the escalation if at its end the alarm still has not been acknowledged. The repetition is carried out 10 minutes after the triggering of the last means.
- Cascade contents : Click on
 to choose the 1st means to be implemented at the triggering of the alarm.
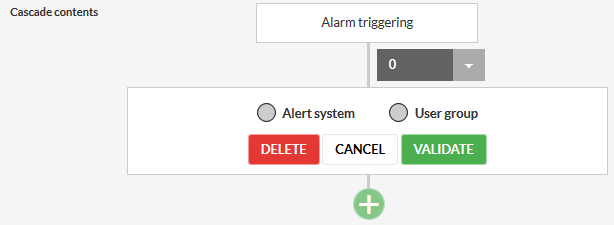
- By default, the time delay for this 1st alert means is fixed at “0 minutes” so that it will be activated as soon as the alarm is triggered.
- Alert system: These are physical means (Buzzer, relay output, light bar) available on the devices deployed in your installation. Choose the one you wish to actuate in the selection list.
- User group: This is the list of users to be notified. During the creation of the users, these can be placed in groups to manage the alerts and to prioritize them if necessary (ex: o, the event of an alert, group 1 will be notified immediately, then group 2 after 10 minutes and so forth).
Choose the group to be notified or create a new group following instructions from JRI MySirius.
Once one of these 2 means have been chosen, click on  then on to add another alert means, proceeding in the same way, adding a triggering delay between the two.
Repeat the procedure for all the other manageable faults.
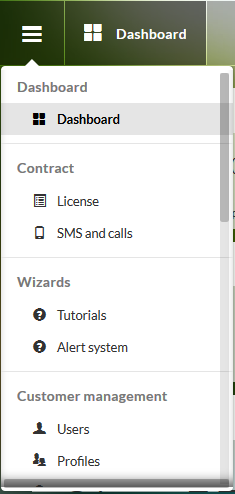
Administration
The Administration section is in the form of a dashboard enabling the administrator to be aware of the perimeter and the state of his installation. This dashboard is composed of tiles or indicators representing the principal elements of his installation.
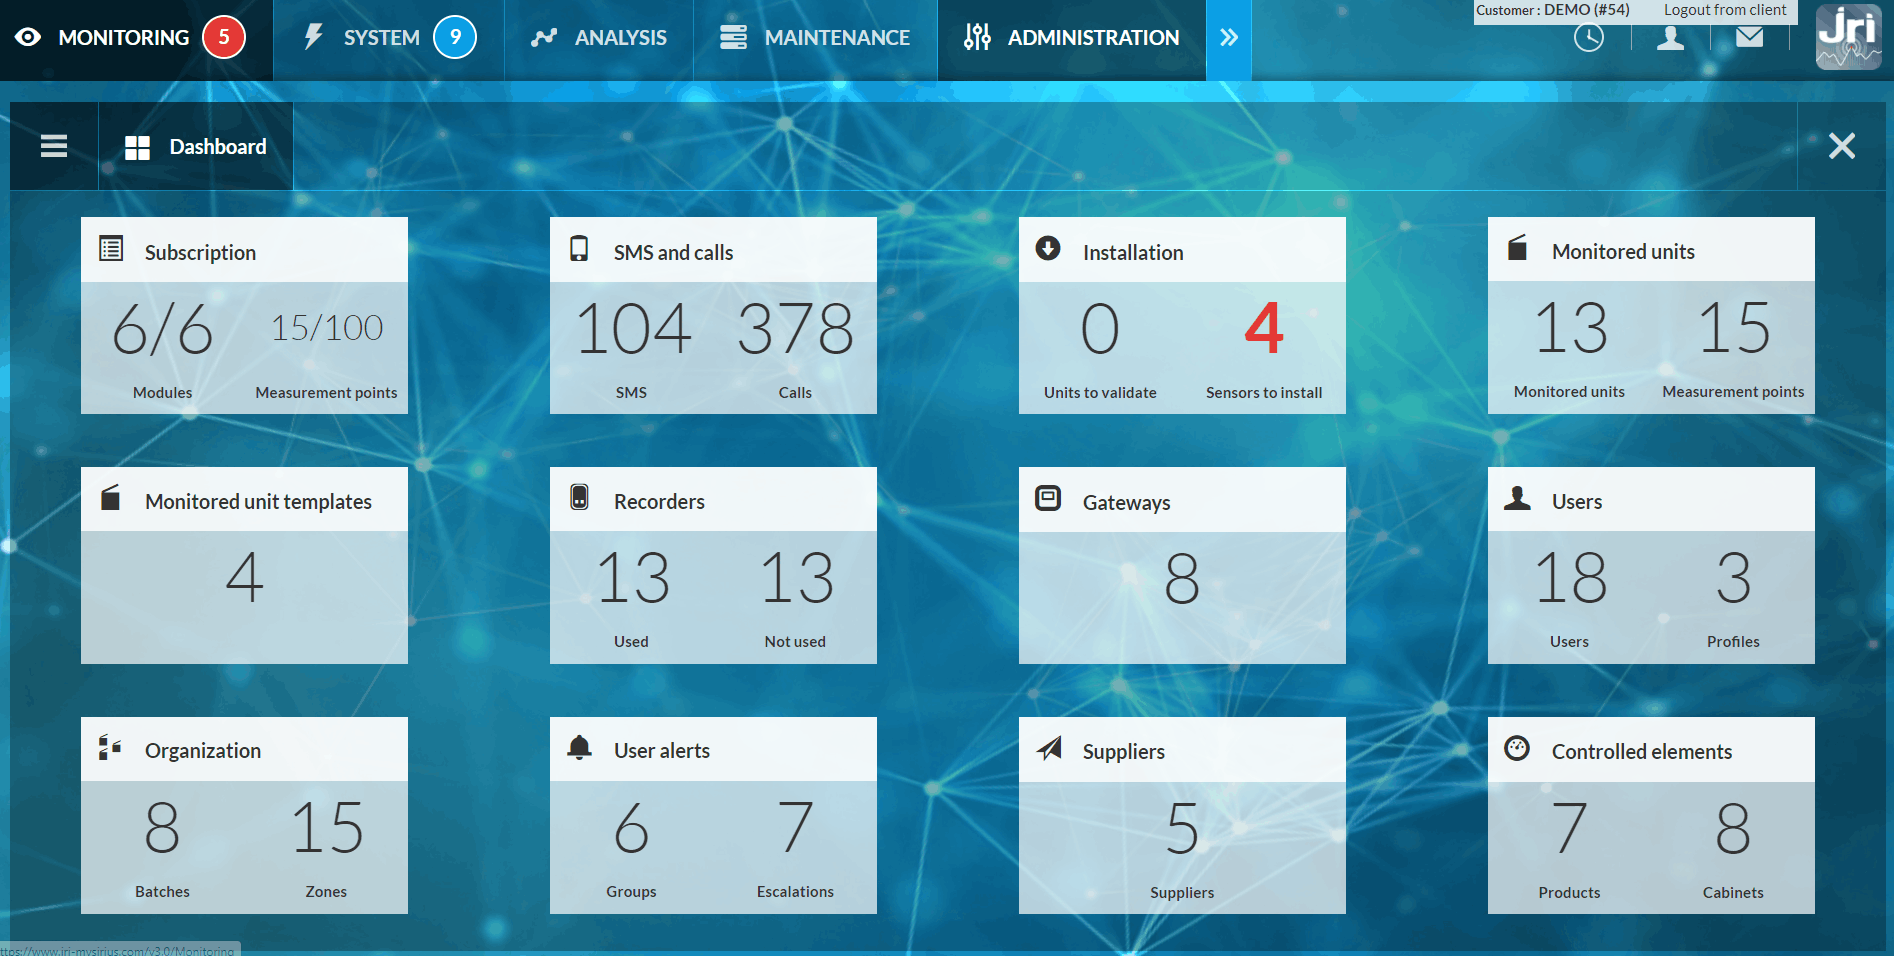
Indicators
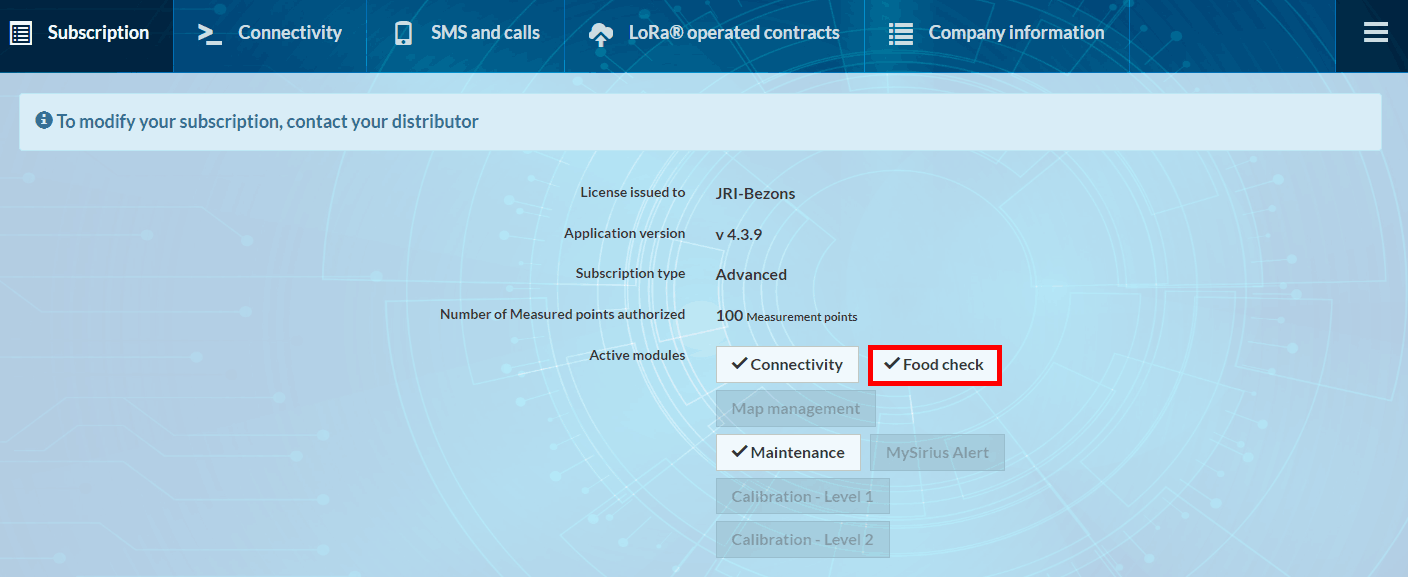
“License” Indicator
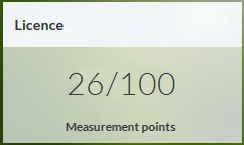
This indicator informs you of the number of measurement points installed as well as the maximum number of measurement points authorized by your license. The indication turns orange above 70% of measurement points installed and red above 90%. Clicking on it displays the offer subscribed to, of which the 3 levels are:
- Initial
- Serenity
- Advanced
** MySirius Licenses **
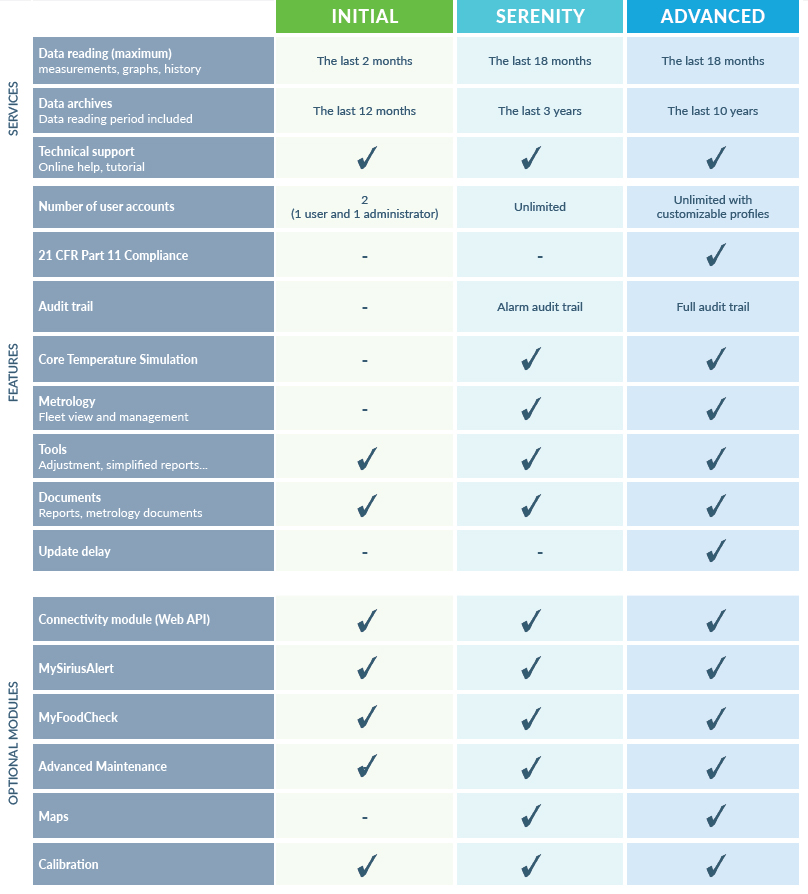
Another tab on this page informs you of the remaining credit for the SMS and voice call alerts
** Multi-versioning management **
If you have an “Advanced” subscritpion level, you have the possibility to delay the upgrade to the latest release of MySirius.
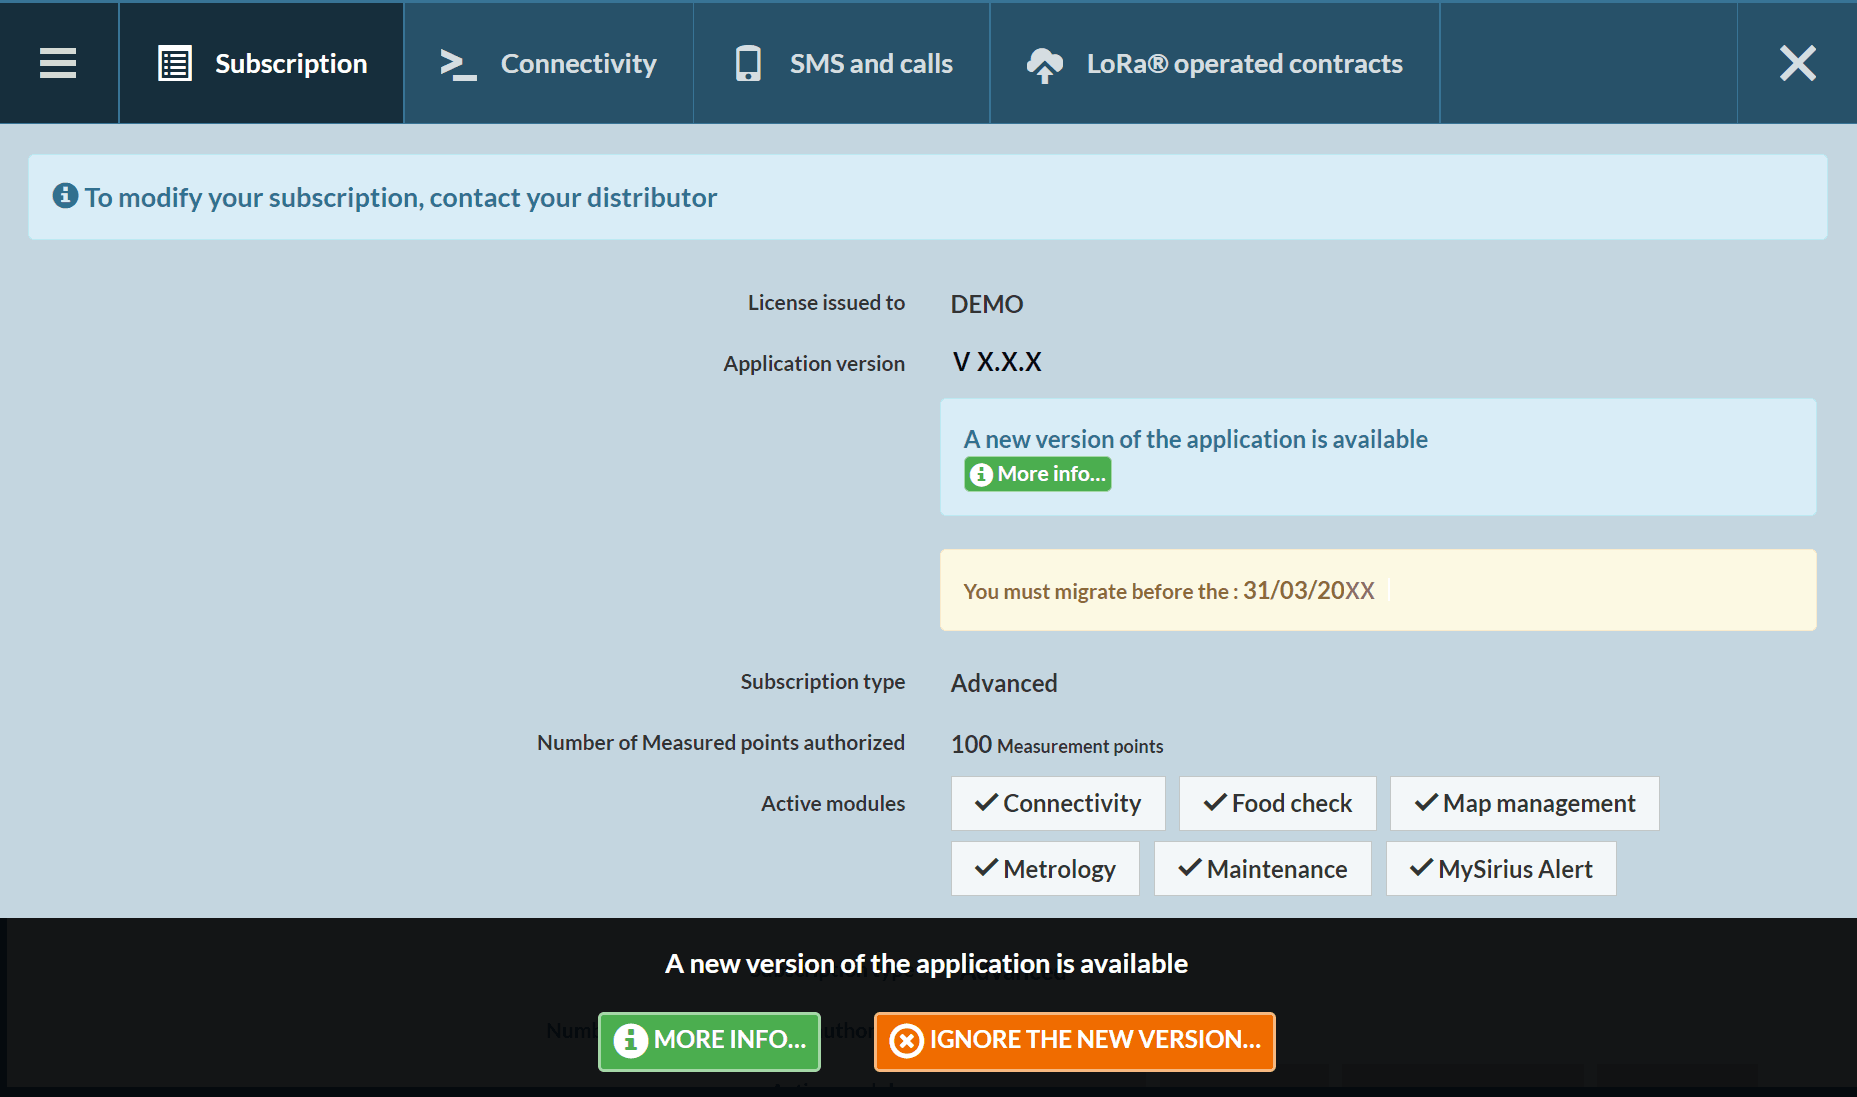
A clic on the “More information” button, gives you acess to details on the latest release.
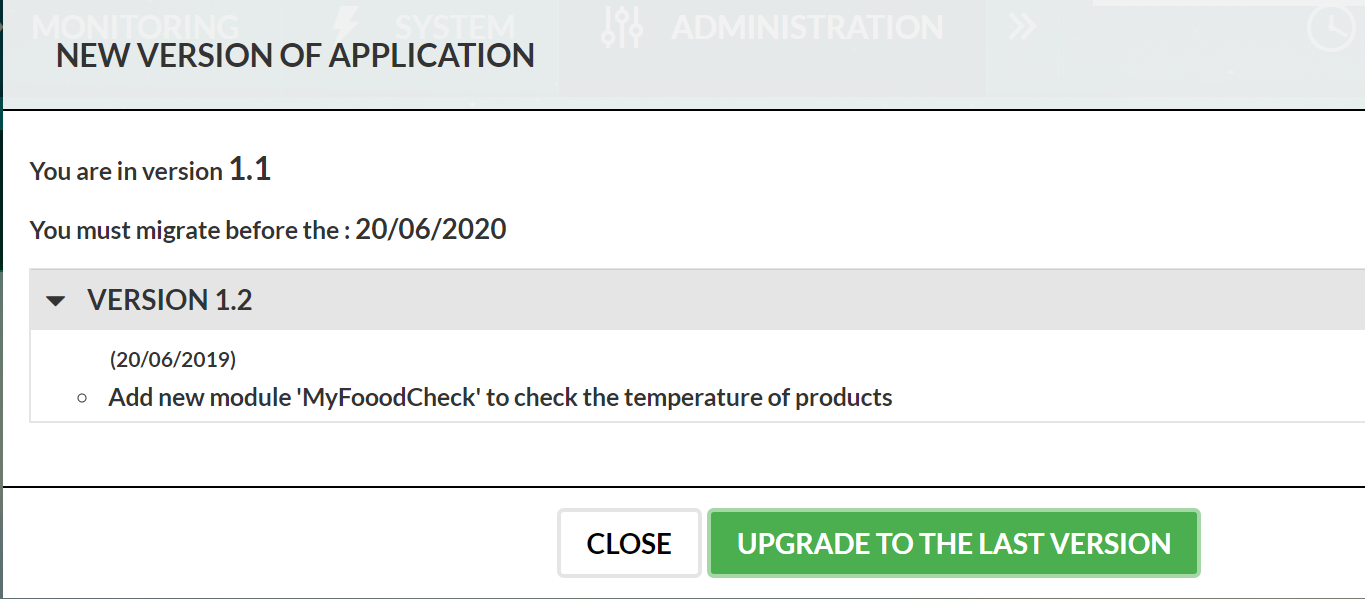
** Modules **
As MySirius is a modular cloud, it is also in the management of the license that you can consult the activated modules.
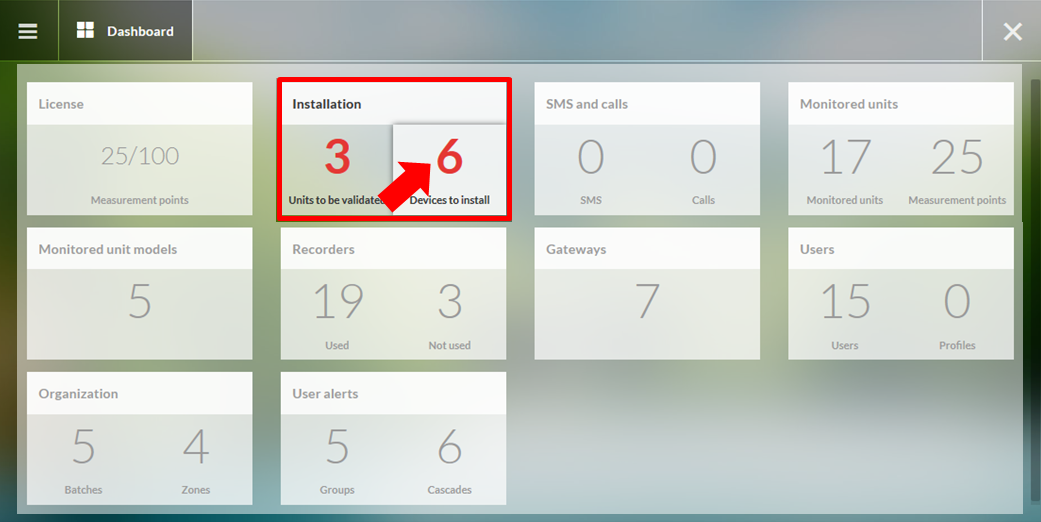
“Installation” Indicator
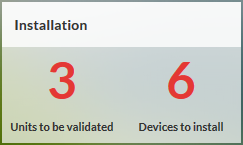
This indicator is double. It shows the number of units having undergone a modification without having been validated and the number of devices available waiting to be assigned to a monitored unit. This information appears in red.
- Clicking on “Units to be validated” redirects you to the monitored unit administration page (see Unit management)
- Clicking on “Waiting devices” redirects you to the management of recorders and measurement points. A window opens listing all devices which are declared and available for unit creation.
“SMS and voice call” indicator
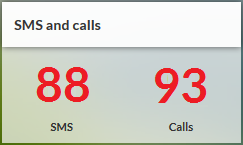
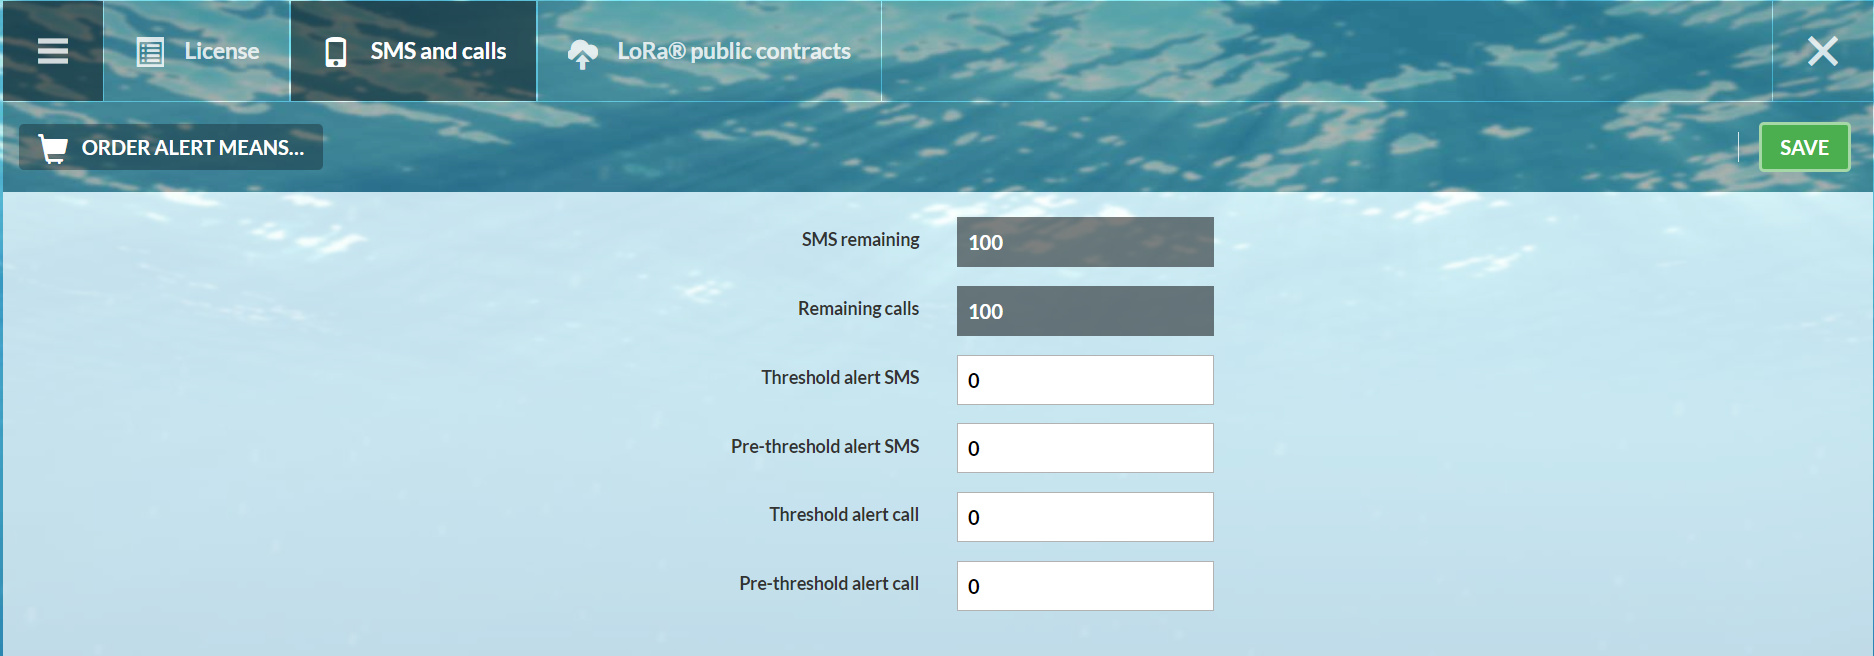
This indicator informs you of the number of remaining SMS and Voice calls. The visual appearance changes to notify you that the thresholds you have fixed have been exceeded and that you must recharge your credit of SMS and Voice calls.
The display turns orange when the pre-threshold is exceeded and red when the threshold is reached.
Clicking on this indicator opens the page enabling you to determine the alert thresholds to reload your credits of SMS and Voice calls.
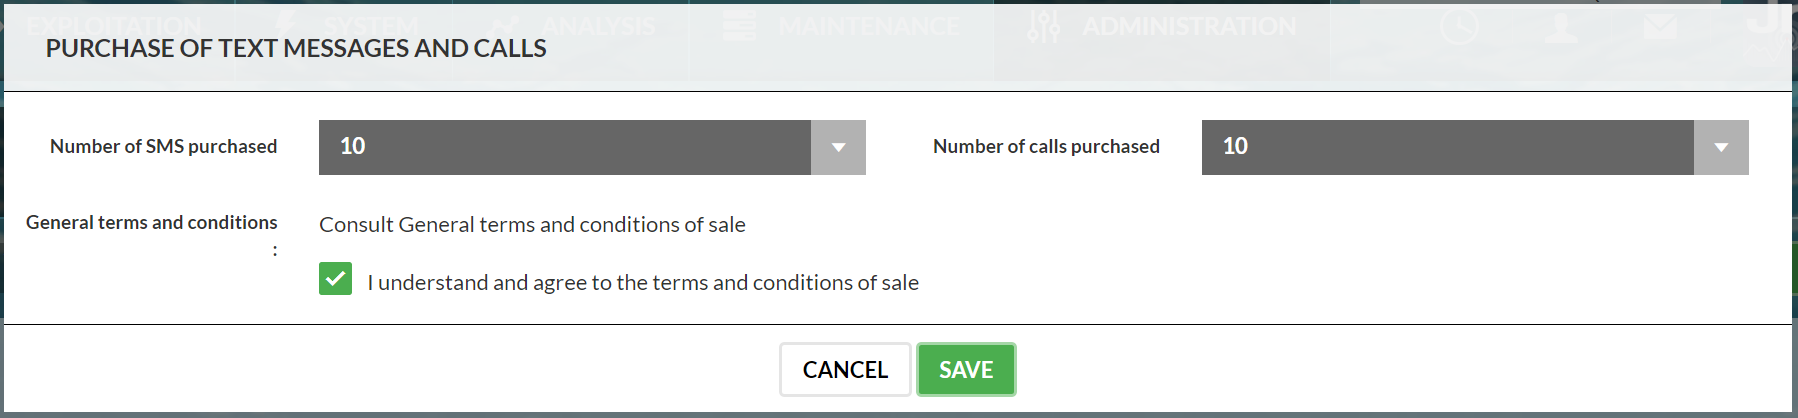
If you’re a direct JRI customer, your account will be automatically topped-up. If you’re a JRI distributor customer, an email will be sent to the distributor so he can top up your account.
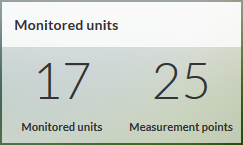
“Units” indicator
This double indicator informs you of the number of monitored units in your installation as well as the number of declared measurement points. Clicking on one of the two elements opens the window corresponding to the title and enables you to then administer its contents (see Unit management).
“Unit models” indicator
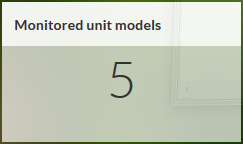
This indicator informs you of the number of unit models that you have created. The monitored unit models allow the creation and configuration at the same time of a certain number of units based on the same measurement points. This function is very useful in the context of large installations in which there is a large number of measurement points and units.
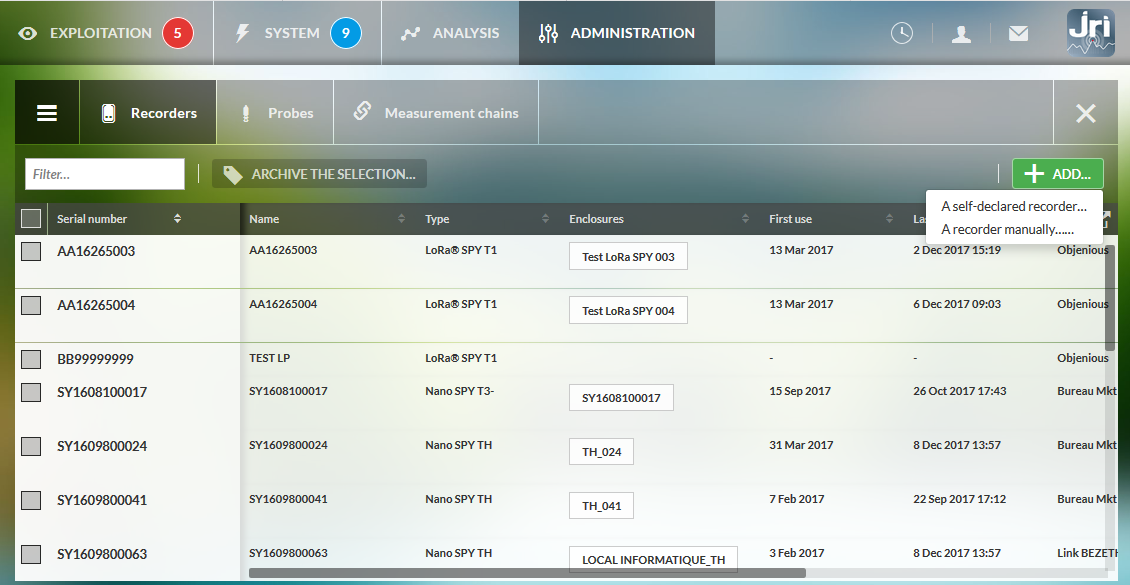
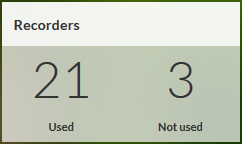
“Recorders” indicator
This double indicator informs you of the number of declared recorders for which the measurement points have been assigned to a monitored unit, but also of the number of recorders which have been declared and are available for unit creation. Clicking on the indicator redirects you to the recorder administration page.
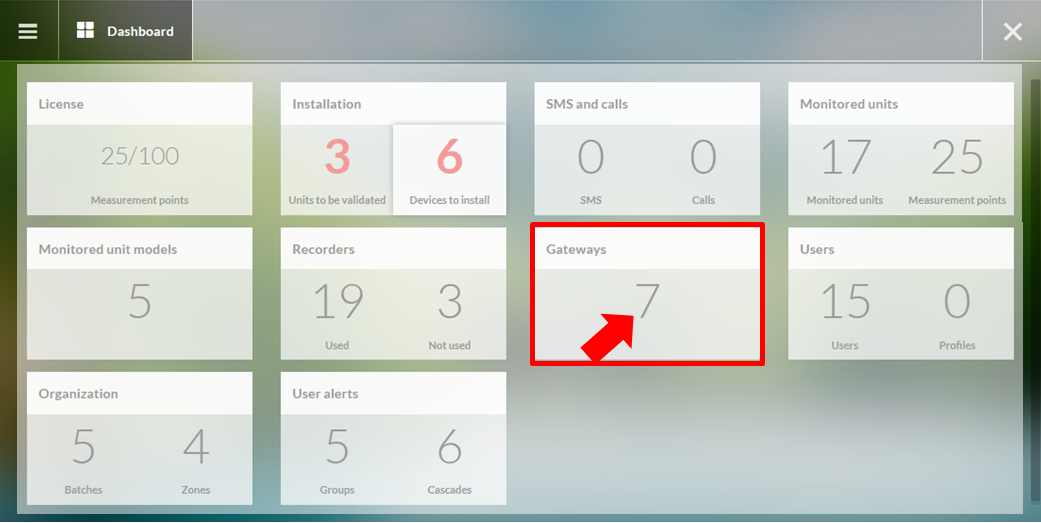
“Gateways” Indicator

This indicator informs you of the number of communication modules declared in your installation.
“User” indicator

This indicator informs you of the number of declared user shaving access to the JRI MySirius monitoring system as well as th number of personalized profiles created (see profile management).
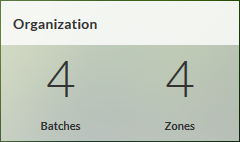
“Organization” indicator
This indicator gives you a view of the organization of your installation with, on one side, the number of declared batches in which your units are distributed, and on the other side, the number os of declared location zones (see zones)
“User alerts” indicator

This indicator informs you of the number of user groups and alert cascades created. This information is important for correct monitoring operation.
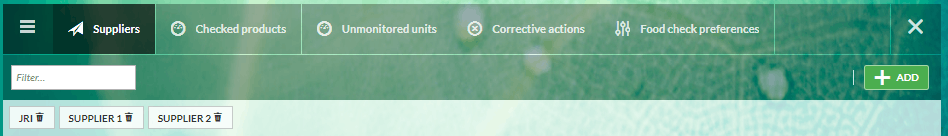
Food Check indicators
SUPPLIERS and CONTROLLED ELEMENTS indicators are visible only for users with subscription to the FOOD CHECK module.
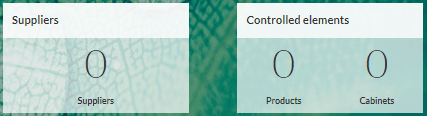
They allow access to the configuration page of the displayed elements on the MyFoodCheck app.
Menu
The administration menu lists all the administration items grouped into general categories. Only the items preceded by an icon are selectable and allow access to administration functions.
Standard administration page
Clicking on any indicator of the administration dashboard or item in the administration menu, a page opens. This page has always the same appearance:
This window is divided into three sections
- The top section

Access button to the general administration menu
 items linked to the current selection
 Button for closing the window to return to the administration dashboard
- Action bar

- The left part contains the field to filter and find the objects listed in the table as well as buttons for action on the selected objects (box to check in front of the object name)
- In the right part are placed the buttons for general actions (addition, creation, recording…)
The action bar changes as a function of the selected items
- The bottom section
Presented in table form, this section lists all the objects declared for the chosen item.
- The first column always presents the item name preceded or not by a box to check. The object name is clickable and provides access to the modification window of the item.
- The other columns provide complementary information on the items
- At the right end of the table header line, the button
 enables adding or masking certain columns and the button
  allows exportation of the table contents to an Excel-type spreadsheet.
Monitored Units management
To access unit management, click on the “Units” indicator, “Installation -> Units to be validated” or via the menu of the Administration page.
The monitored unit management window shows the following features:
- Different tabs: Batches, Unit models and Units
- The button giving access to the menu of the different administration functions of the JRI MySirius monitoring system
- The monitored unit management toolbar
- The monitored unit list in tabular form
Units management
Unit toolbar

- Filter…: Field for finding units when the list is too long. Entering the characters of the name will result in the display of all units having these characters anywhere in their name.
The 3 following buttons are only active if at least one unit is selected. Each unit name is preceded by a box to check enabling its selection.
Manage the selection allows :
- Placing or moving the selected units in a zone
- Placement of one or more selected units in one or more batches, or creation of a new batch
Application of a configuration model
 button for archiving one or more selected units
Apply the modifications : When a monitored unit has been modified, an orange label appears beside its name. Click on this button to apply the modifications.
Finally, the button allows adding a new unit (see unit creation)
Unit list
The list of created units is displayed in table form:
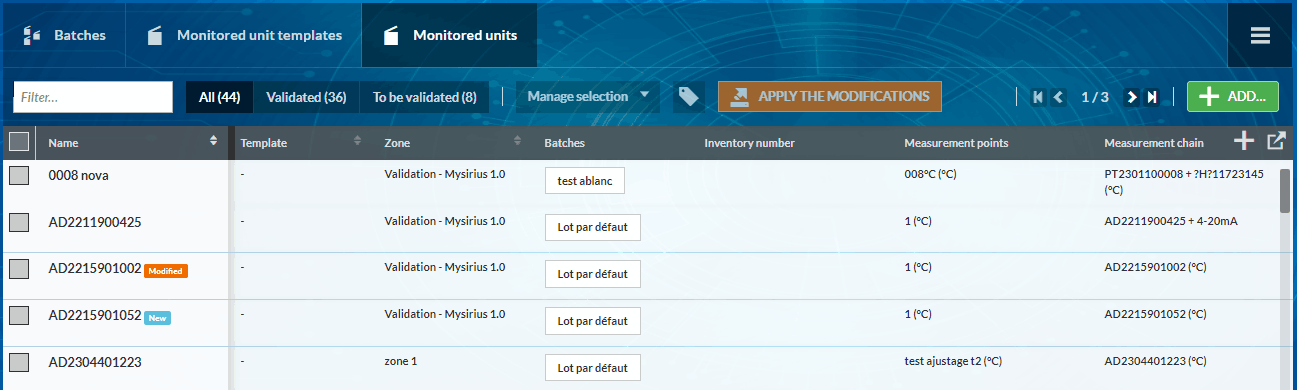
This table shows all unit information:
- their names,
- whether they have been configured using a model,
- to which zone(s) and batch(es) they belong,
- the names of their measurement points,
- their configurations.
At the far right of the table header line, the button allows displaying or masking the table columns except that of the name.
The button allows export of the table to a spreadsheet.
The 3 first columns of the table have a button for ranking the monitored units by name, by model or by zone.
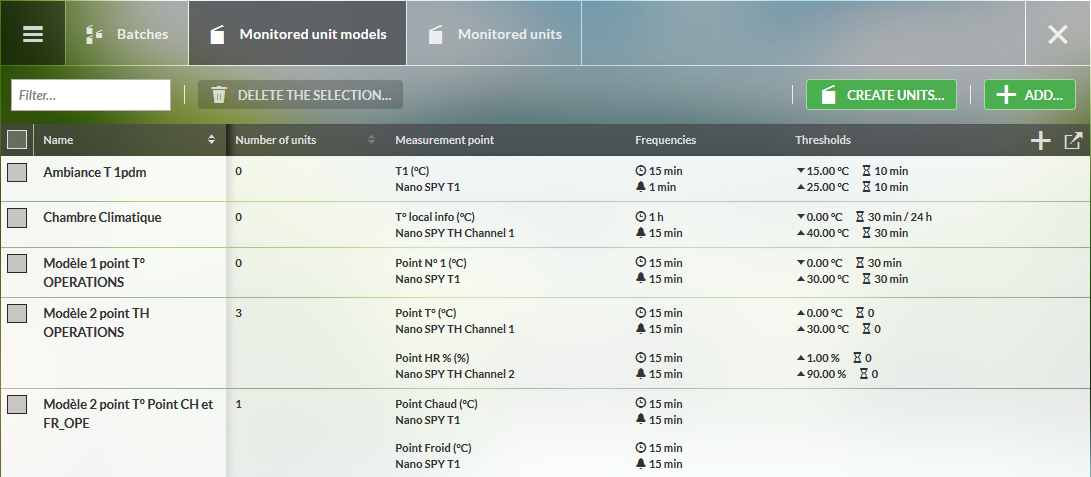
Monitored Units Templates management
To access unit model management, click on the “Models” indicator, or on the “Unit models” tab in the monitored unit management window or via the menu from any open page in « Administration ».
The monitored unit models window has the same features as the monitored unit management window:
- Different tabs: Batches, Unit models and Units
- The button giving access to the menu of the different administration functions of the JRI MySirius monitoring system
- The monitored unit management toolbar
- The monitored unit model list in tabular form
Monitored Units Template toolbar

- Filter…: Field for finding unit models when the list is too long. Entering the characters of the name will result in the display of all unit models having these characters anywhere in their name.
- Delete the selection : This button is active only if one or several models are selected via the check boxes in the model list.
- Create units : This button allows the creation of units directly from a model without passing by the monitored unit management page.
- Add : This button is for adding new unit models. The creation of unit model sis identical to the creation of units but without associating a measurement chain (see unit creation).
Monitored Units Templates list
This table has the same features as the monitored unit list table with the same action buttons. (see unit table)
Batch management
To access batch management, click on the “Batches” tab in the monitored unit or unit models management window or via the menu from any open page in Administration.
The “Batches” window has the same features as the monitored unit model management window:
- Different tabs: Batches, Unit models and Units
- The button giving access to the menu of the different administration functions of the JRI MySirius monitoring system
- The batch management toolbar
- The list of batches in tabular form
Batches toolbar
- Filter…: Field for finding batches when the list is too long. Entering the characters of the name will result in the display of all batches having these characters anywhere in their name.
- Delete the selection : This button is active only if one or several batches are selected via the check boxes in the model list.
- Create units : This button allows switching to creation of units during batch creation.
- Add units : This button allows opening of the monitored unit list beside the table.
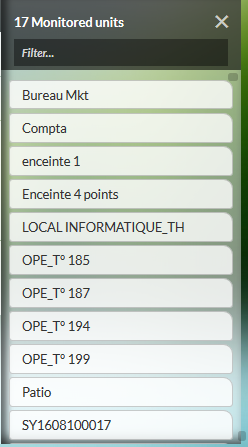
Place the monitored units in the batches by a simple click and drag
Add This button is for adding new batches (see batch creation).
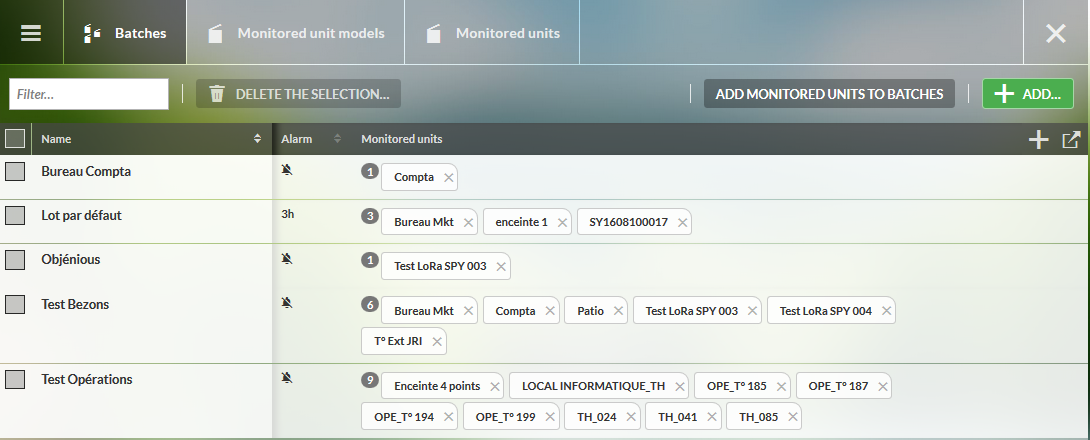
List of batches
This table has the same features as the table of unit list with the same action buttons.
The Name column enables identification and selection of a batch. Clicking on the batch name allows modification as well as adding or deleting units.
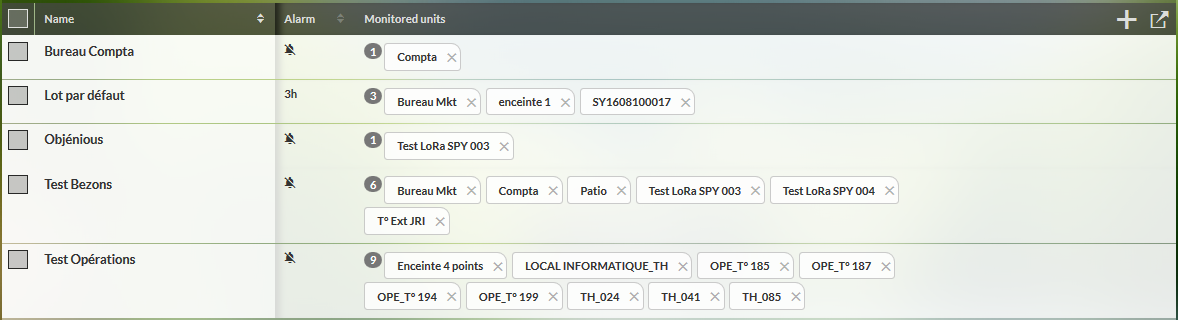
The Alarm column informs whether or not a communication error alarm is defined for this batch. * When a communication error alarm is defined for a batch, the time delay for taking in charge the alarm is displayed. * When there is no communication error alarm defined for a batch, the symbol  is displayed in the column.
The Unit column indicates the number of units in the batch as well as the monitored unit list. Each unit is represented by an active vignette: * click on the cross to remove it from the batch, * move the monitored unit to another batch by click/drag.
User management
This is one of the most important sections of JRI MySirius. It is here that all users will be declared, that their rights will be determined in order to allow their optimal use of JRI MySirius.
Add a user
Click on “Add” to declare a new user
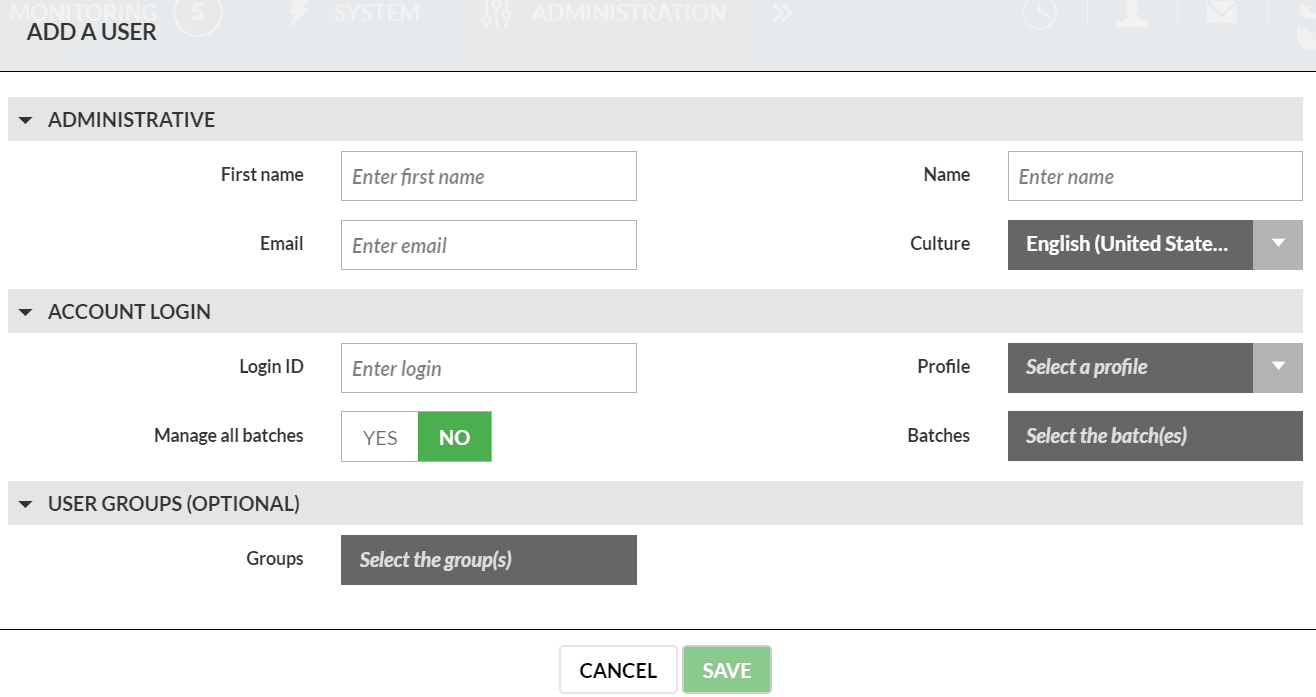
- Administrative : Concerns the administrative data of the user, his identity, his region but especially his email address.
Access account : concerns the action perimeter of the user. It is here that the administrator sets the rights of each user, first in setting his profile (authorized actions - see profile management), giving him access to certain batches and geographic zones of the installation.
User group: Allows assigning a user to a group. This information is very important for alert management.
Next click on “save” to confirm the creation of the user. The two first sections must be completely filled in in order to save.
Managing user groups
To manage User Groups, go to Alarm System Management>User Groups.
Add a new User Groups
To add a new user groups, click on the “Add” button.
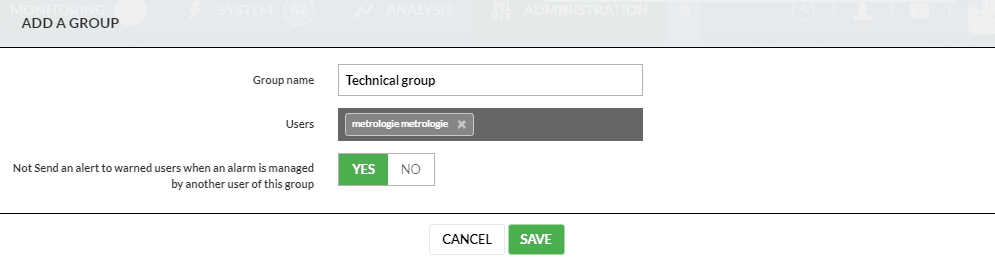
Choose a group name
Add users to the group : Add users to the group.
Receive or not an alert when a user in the group is managing an alarm: When this option is set to “NO”, a message is sent to other users in the call group when the alarm is acknowledged. The name of the user who acknowledged the alarm is included in the message.
Modifying a user groups
To modify a new user group, click on the group.
Add a Supervisor
- A “supervisor” is a particular user who can see multiple clients. For a person to be a “Supervisor” of multiple clients, each client must declare that person as supervisor and give him / her rights.
To add a “Supervisor”, click ** the “User” indicator ** of the Administration dashboard then the “user tab” in the client management window and then ** “Add” ** in the action toolbar to declare a new “Supervisor”. Two choices are possible:
- Add an existing supervisor
- Add a new supervisor
Add an existing supervisor
If no supervisor already exists, you must first create one (see “Add a new supervisor”).
To be added to other clients, the supervisor will have to ask another client’s administrator to add him. This request is not made via MySirius. He must communicate his login / domain to the right person who will follow the procedure below to add him.
To add an existing supervisor, you must enter ** the login and domain ** of the existing supervisor and choose the profile he will have when logging on to the current client (a supervisor can be an administrator for a client and a simple user at another). After validation, if the profile exists, it is added to the list of supervisors.
Add a new supervisor
To create a new supervisor, you must fill in the fields on the identity of the future supervisor, define the login and choose the profile he will have to log on to the current client. It is recommended to enter an email address. After validation, the “supervisor” is created and the password is sent by email to the filled-in address.
By logging in, a supervisor accesses the list of clients he can view.
For each client, the client name is displayed, the number of units and or devices in alarm (same numbers as in the menu).
By clicking on one of them in the list, the client is open and the supervisor can perform tasks based on the profile assigned to that client.
Supervisors do not appear in the client’s list of users. They can not be used in the customer alert system.
Supervisors can see all batches. It is not possible to assign them to a batch.
Deleting a supervisor
- At any time, an administrator can remove a supervisor. It is only deleted for the current client. If the supervisor can consult other clients, it is kept (only the link with this client is broken), otherwise the account is deleted.
Profile management
Three default profiles are available in JRI MySirius:
- Administrator,
- Batch manager,
- Simple user,
- Simple reader,
- Metrolog Technician,
- Metrolog Manager,
The table lists the rights of these different profiles. It is impossible fo modify or delete them.
JRI MySirius nonetheless allows the creation of personalized profiles.
Customised profiles
Click on “Add” then select which type of profile you wish to create: an administrator, a batch manager or a simple user.
The window of the basic profile of your choice opens:
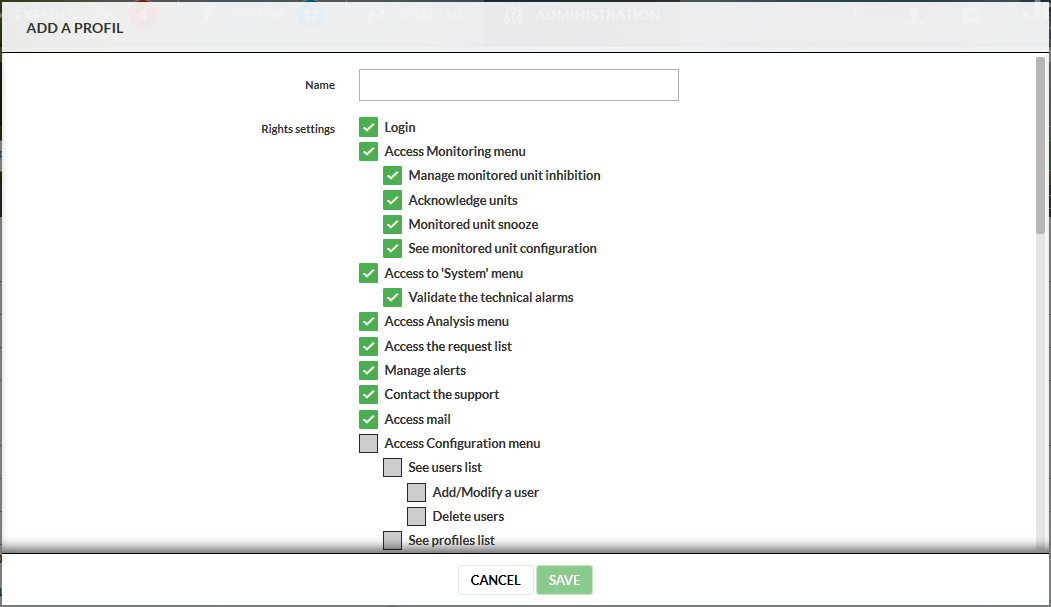
The rights attributed to the basic profile are checked:
- Enter an ID for this new profile,
- Check or uncheck the rights,
- Click on save to confirm the creation.
Once confirmed, the new profile is displayed in the profile table. The profiles, whichever they are, are not modifiable.
Deleting a profile
- Only added profiles can be deleted
- When a profile is deleted, the substitution profile chosen at the moment of deletion is applied to all concerned users.
User account management
Each user has access to his profile to allow him to update his personal data and his JRI MySirius environment as well as manage his alerts. (See User account management in the user guide). The user can in no case manage the parameters related to attributions such as the list of his rights and his user profile
Secure access
- Securing access is an important function for users wishing to comply with the requirements of the pharmaceutical industry (21 CFR part 11) guideline or for those who have implemented a quality approach with a secure management of accessibility to computerized application.
To access, click on the “Secure access” tab in customer management or else directly from the administration menu.
This function allows management of the conditions of access to the system:
- lifetime of passwords
- password length
- number of login attempts
- …
If needed, the administrator has the ability to force all users to renew their password by clicking on the button “Force users to change password”
Conformité FDA 21 CFR part 11
Access to MySirius is by login, password and domaine.
By clicking on “Apply FDA 21 CFR Part 11 parameters” the different choices are automatically configured according to the criteria requested at least part of the FDA. It is then possible to adjust each of them to comply with the requirements of the quality approach.
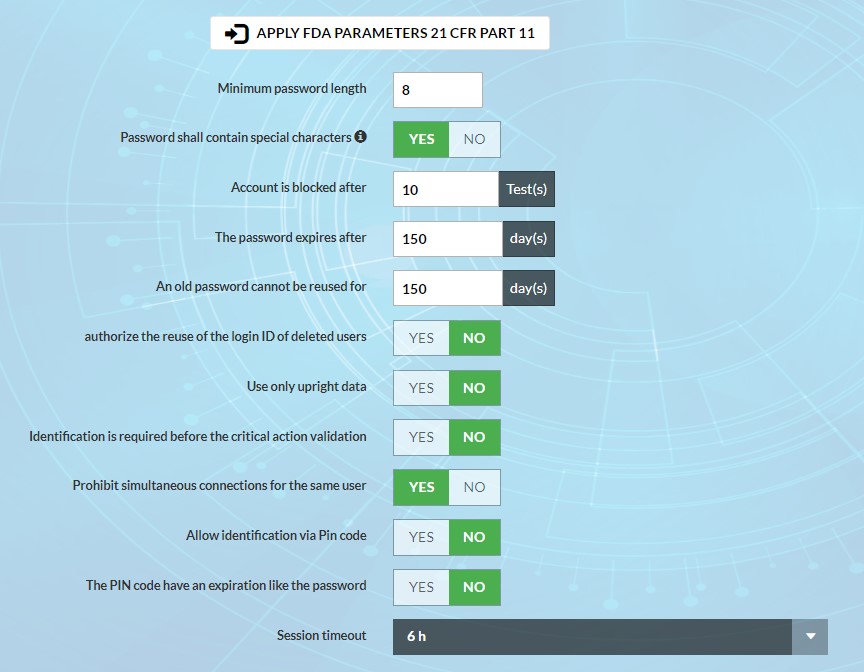
- Minimum password length: It is recommended to set a minimum length of 8.
- Password with special characters required: If this option is enabled, the password must contain an upper case letter, a lower case letter, a number and a special character.
- Account blocked after: The locking of an account following several mistakes in the input of an MdP can be set. For pharma mode, the default value is 3 attempts before the account is locked. A lock icon is activated for this user in the user list.
- Password renewal: The length of time the MdP can be used can be set. For pharma mode, the default is 90 days.
- Reuse of an old password. For pharma mode, this period is set to 180 days by default.
- Reuse of a deleted user ID: The reuse of a login is configurable. For the pharma mode, by default the login of each user is unique and cannot be reused. If a user leaves, his login is archived but not deleted.
- Use only upright data: When this option is activated, incorrectly timestamped measures ( - 15 minutes in the past, + 1 in the future) will be rejected. A reset command will be sent if necessary and possible, to avoid large measurement gaps. If there are missing measurements, MySirius does not average the previous measurement to the next measurement to fill the gaps in the graphs.
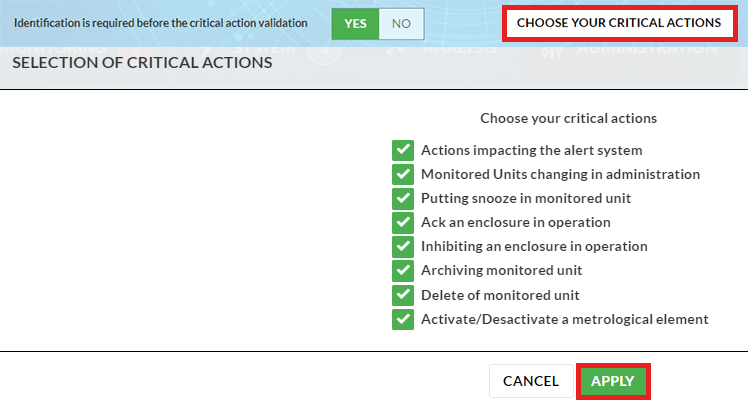
- Validation of critical actions: A signature (login and MoP) is requested in the case of a critical action. Critical actions are the following: Acknowledgement / snooze of an enclosure in threshold alarm / Inhibition and modification of thresholds and time delays of a measuring point / Archiving of an enclosure or a measuring point / Modification of user alerts / Activate or Desactivate a metrological element. From version 2.2 of MySirius, it is possible to customise the list of critical actions.
- Simultaneous connections: The possibility for a user to open two different MySirius sessions is configurable. For Pharma mode, this is not allowed by default. If a simultaneous login is attempted, the first session is automatically closed.
- Allow login with PIN code: Feature to be enabled for MyFoodCheck users to facilitate access without entering a password.
- PIN code expiration : It is possible to choose whether the PIN should expire or not after the password linked to the account has expired.
- Automatic logout: Automatic logout after a certain time without using the mouse can be set. After this time, the user will have to authenticate again. For Pharma mode, this time is set to 15 minutes by default.
General preferences
To access, click on the “General preferences” tab in customer management or else directly from the administration menu.
This function allows the configuration of certain tasks performed or proposed by JRI MySirius:
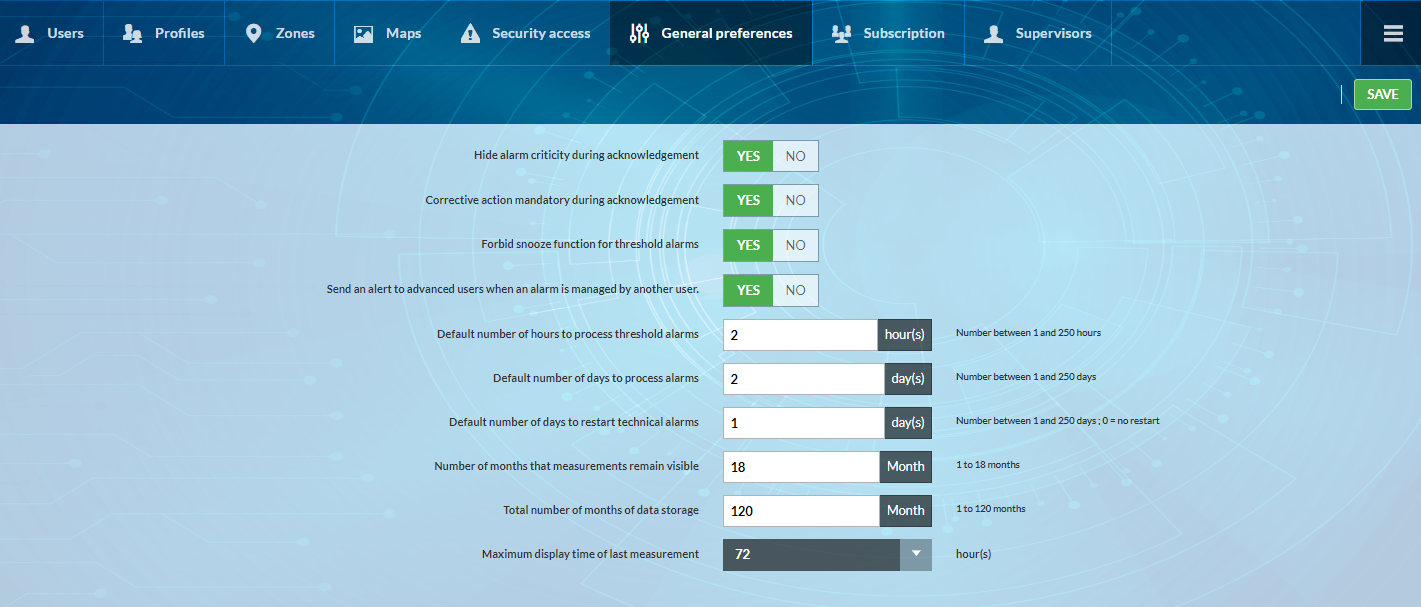
** Hide alarm criticity during acknowledgement…**: When the selector is set to “NO”, the user acknowledging the alarm must fill in the field concerning the criticality of the acknowledged alarm.
Corrective action required…: When the selector is placed on “YES”, the user who acknowledges the alarm must fill in the field concerning the corrective action which he has carried out to fix the problem.
Prevent the “snooze” function…: When the selector is placed on “YES”, it will no longer be possible to snooze the alarms. Only acknowledgement and taking in charge are possible.
Send an alert to users…: When this option is set to “YES”, a message is sent to the other users in the call group when the alarm is acknowledged. The name of the user having acknowledged the alarm is included in the message.
Default number of hours for threshold alarms…: Enter here the duration that JRI MySirius will systematically propose to any user who takes over an alarm. The user will be able to change it according to the intervention required to resolve the problem.
Default number of days for technical alarms: Enter here the duration that JRI MySirius will systematically propose to any user who takes charge of a technical alarm. The user will be able to change it according to the time it may take to bring the affected equipment back into compliance.
Number of days for reactivating technical alarms : When a technical alarm is not processed immediately (validated or taken over), it is not resent by the device, which remains in failure. In this field, enter the frequency at which the alarm should be reissued to bring the equipment back into compliance.
Number of months of measurement consultation and total storage : These two parameters are filled in (maximum duration) according to the MySirius JRI offer subscribed to. However, it is possible to customize them by reducing the maximum duration.
Inactivity time before disconnection: Enter the time after which the user’s session will be automatically closed if no activity is detected by JRI MySirius.
Maximum duration for displaying last measurement: Set the duration for which the last measurement received by MySirius from a logger will be displayed in the “Operation” menu. For example: If the selected value is 24h, then if no measurement has been received by MySirius for more than 24h in the “Operation” menu. The display will show “—” instead of a numerical value.
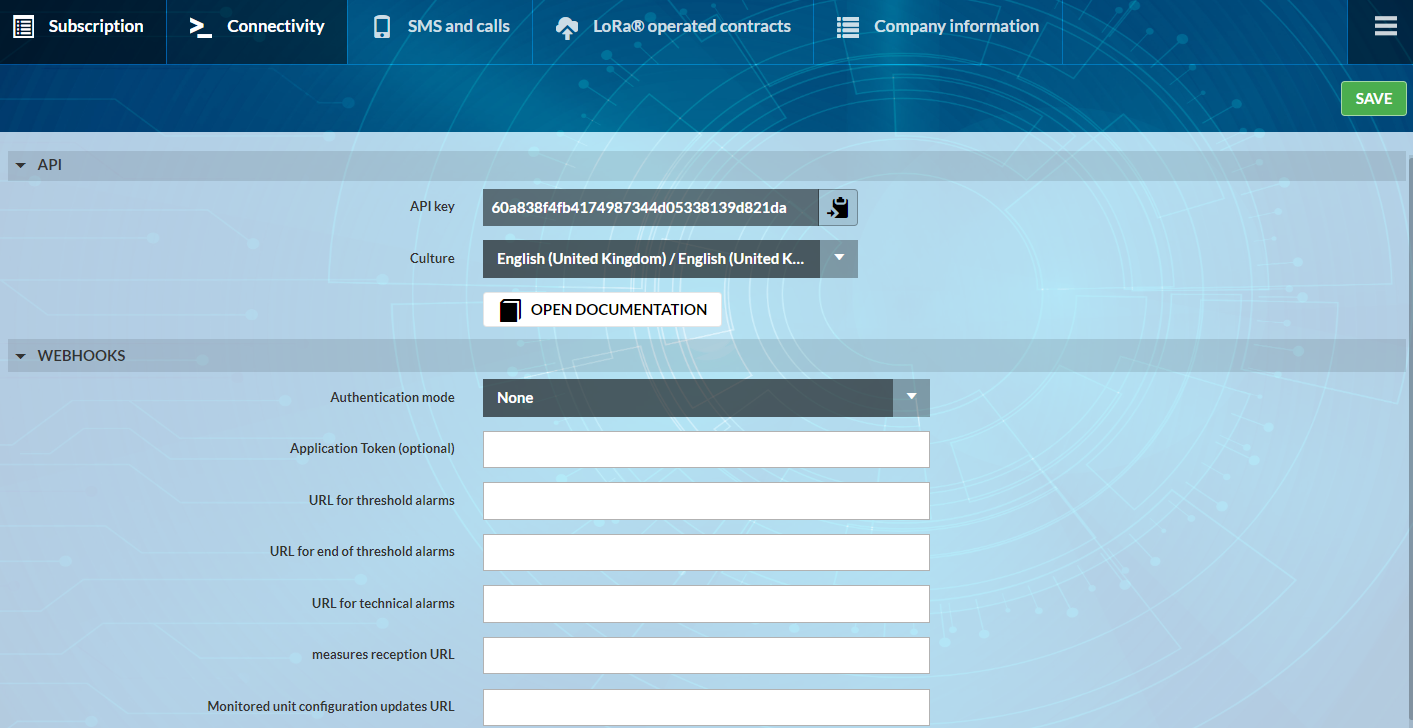
Connectivity Module
The optionnal “connectivity” module is used to “link” MySirius with another application to provide the data it needs. If you have subscribed to the activation of this module, all the information you need to develop an application allowing you to link MySirius with your application is available in: ** Administration \ Subscription \ Connectivity \ OPEN DOCUMENTATION **
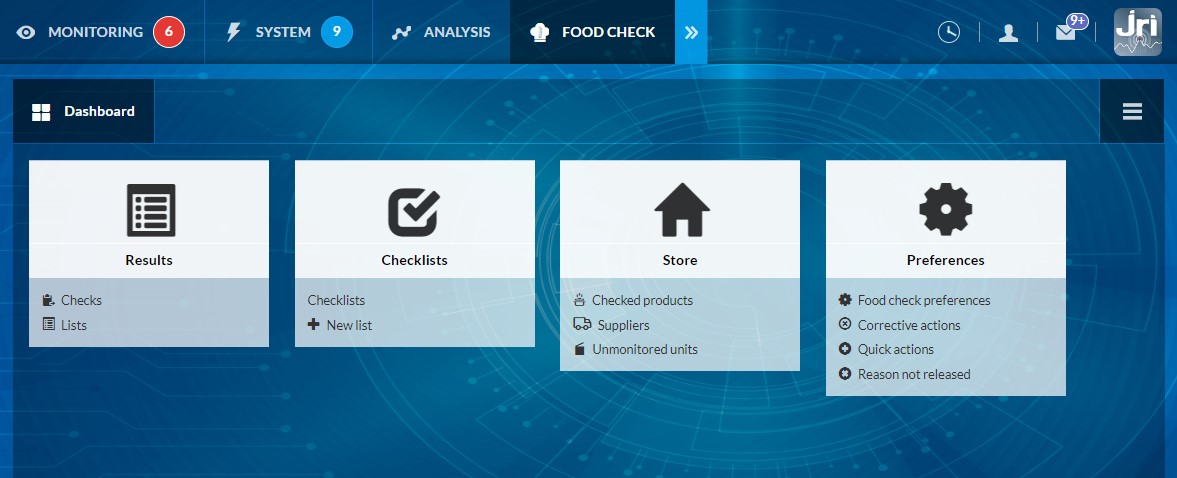
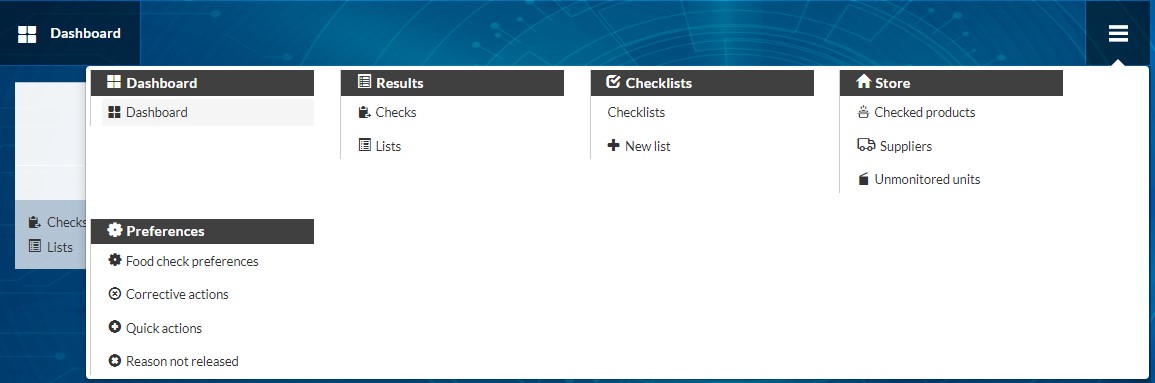
FoodCheck Module
The optional “MyFoodCheck” module is designed for food service professionals. In compliance with HACCP procedures, it simplifies food temperature control operations.
If you subscribe to the “MyFoodCheck” module, an additional tab appears on your MySirius page allowing you to display a dashboard. Click on the left-hand menu to display more features.
Maps Management Module
The optionnal Maps Mangement Module is designed to help users locate the monitored units and JRI devices onsite.
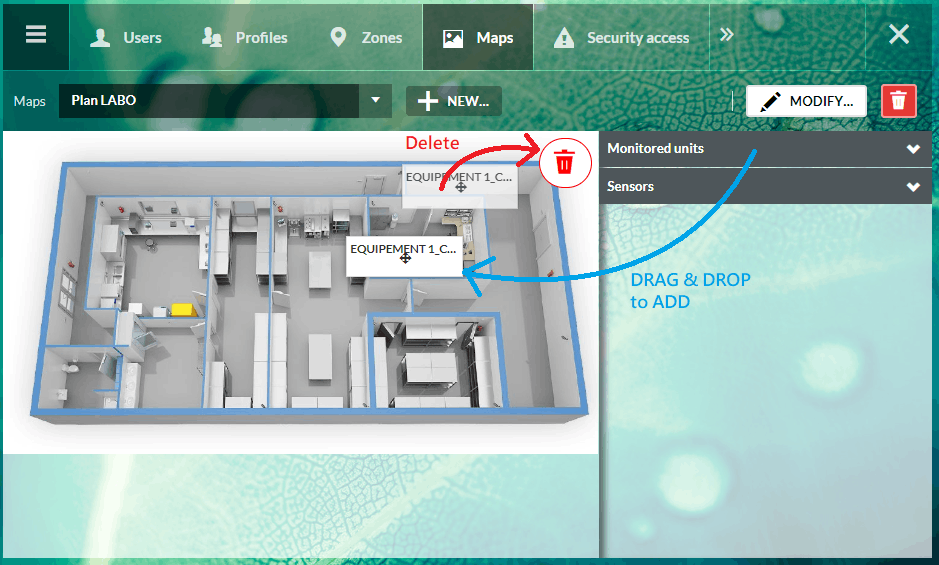
Add a map
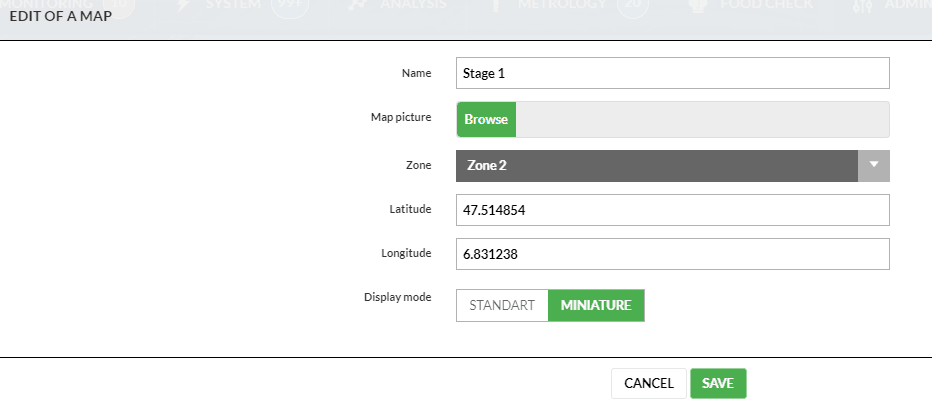
To add a map, go to ADMINSITRATION, open the left MENU then clic on MAPS. Or, from the ADMINISTRATION menu, clic on ORGANISATION tile then ZONES and MAPS. Clic on the ++ NEW button to add a new map.
Select an image (JPEG, PNG) in the new window that opens, name your map, choose the ZONE to link and save. The added maps are displayed in the maps list of the MONITORING tab according to the tree structure of associated Zones. GPS coordinates of a map (a building) can be added for geolocation. Select the Display mode to choose between a standard view and a miniaturized view. The miniaturized view displays only the status of the oven, so as not to overload the display with information. This information is relevant for the MySiriusAlert application use.
Units and devices position
Once a map is added, drag’n’drop the units or the Gateways to their exact position on the map.
The basket can be used to delete a position.
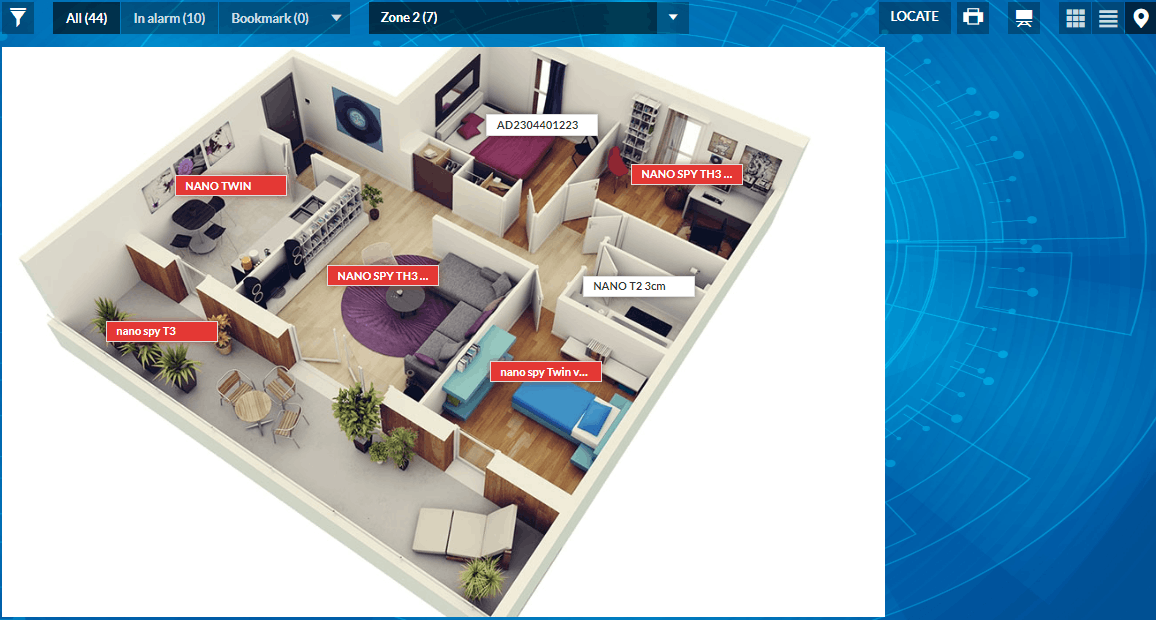
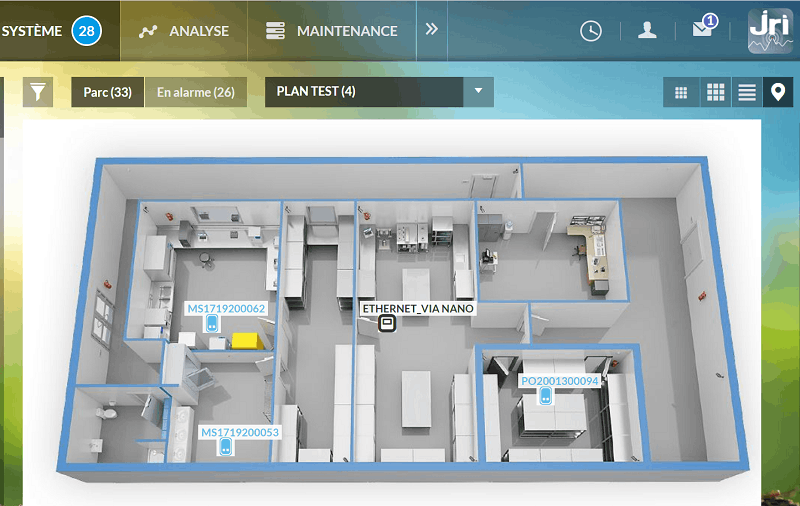
Units and Gateways view in Maps Mode
- On the MONITORING page the button
 allows switching to the maps mode in order to locate the equipements. Small thumbnails represent the loudspeakers on the map, with information on their alert status. To view the latest measurement and speaker curves, simply click on the thumbnail. A drop-down list displays plans with their associated zone tree structure.
- On SYSTEM page , the same button shows the position of the devices (Gateways and sensors).
Metrology Module
The METROLOGY tab is visible for all MySirius clients even if the optionnal CALIBRATION module is not activated.
On the dashboard, you can quickly view the list : * List of chambers and measuring chains on which a metrological operation is required. * The number of self-calibrations in progress.
- It allows to display the metrological information of all recorders/probes. The download button
 can be used to get the metrological reports if available ( Mapping reports, calibration certificates…)
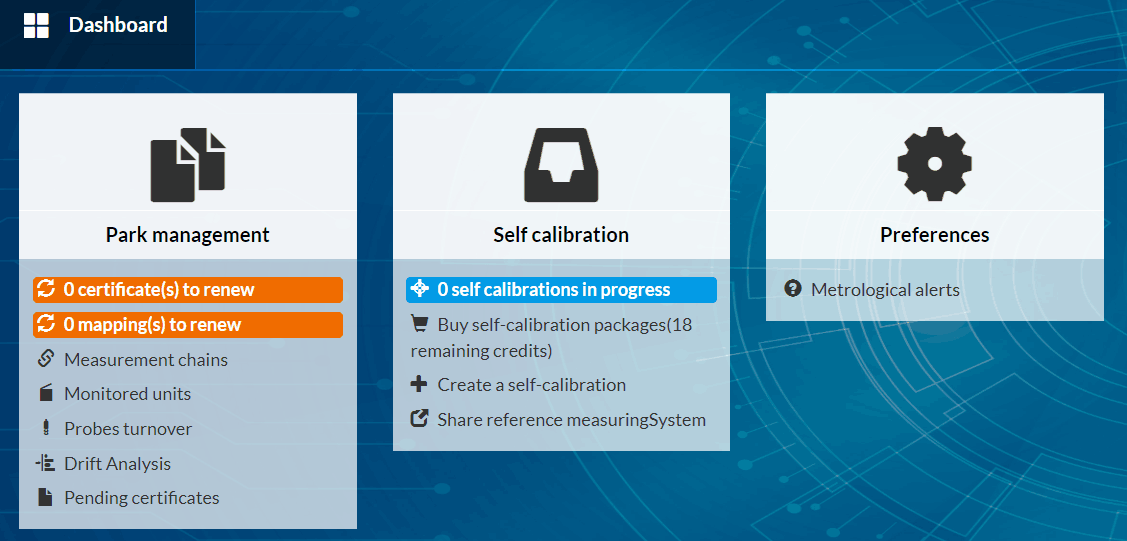
Park management
The " Park management " window lets you manage your entire metrological park. * Indicators of certificates and mappings to be renewed: List of enclosures and measuring chains on which a metrological operation is required. * List of measurement chains, enclosures and pending metrological certificates. * Probe rotation history * Perform drift analysis
Metrology tasks to renew
It’s a double indicator :
- The number of mapping to renew:
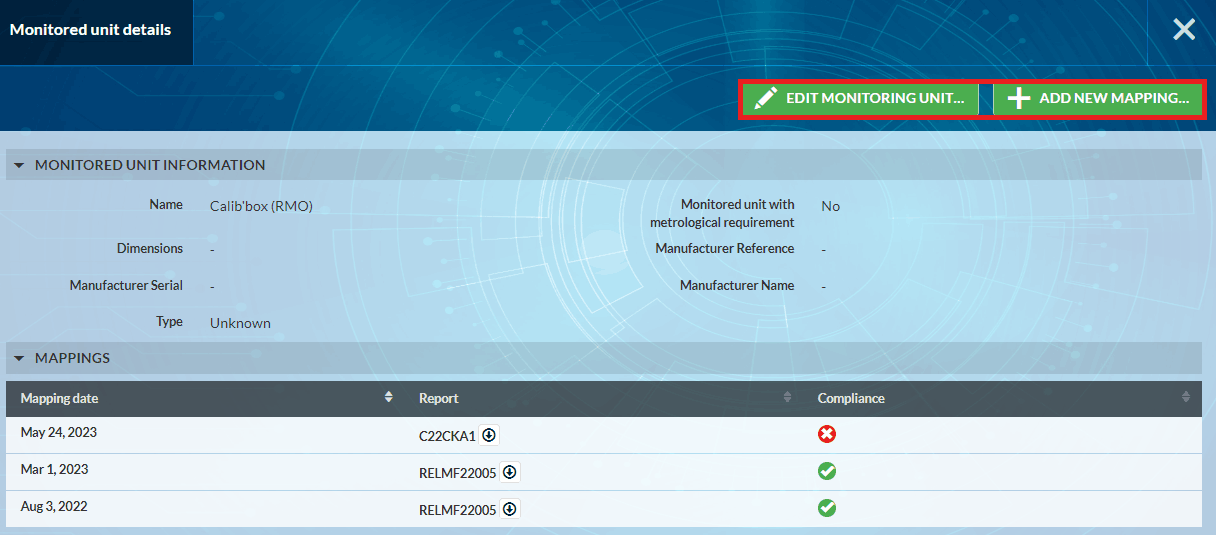
By clicking on this indicator, you have aceess to the list of units mappings. Mapping to be renewed are shown in blue in the list.
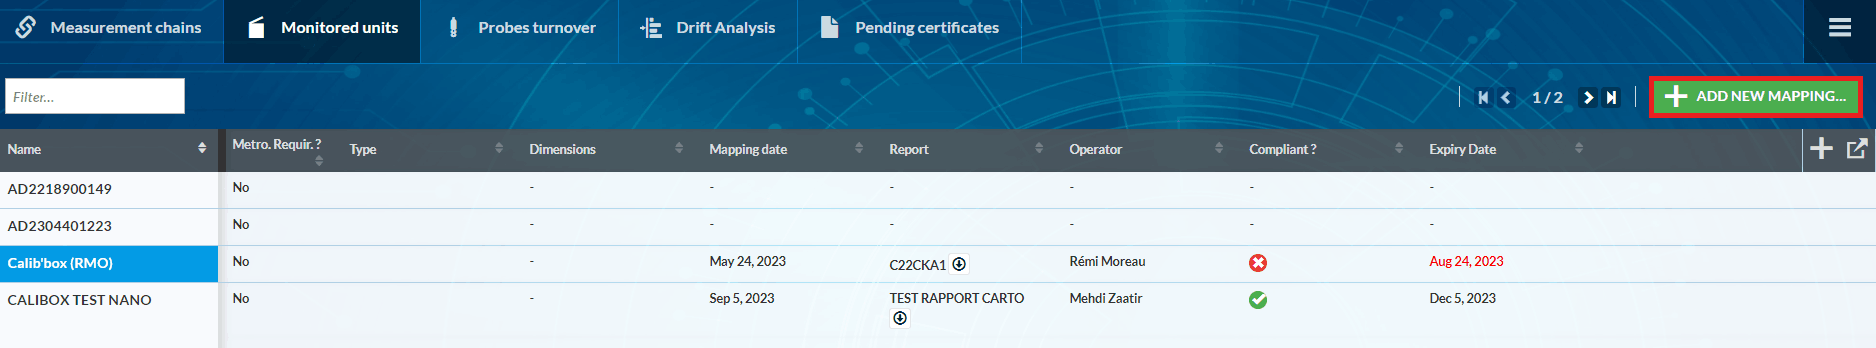
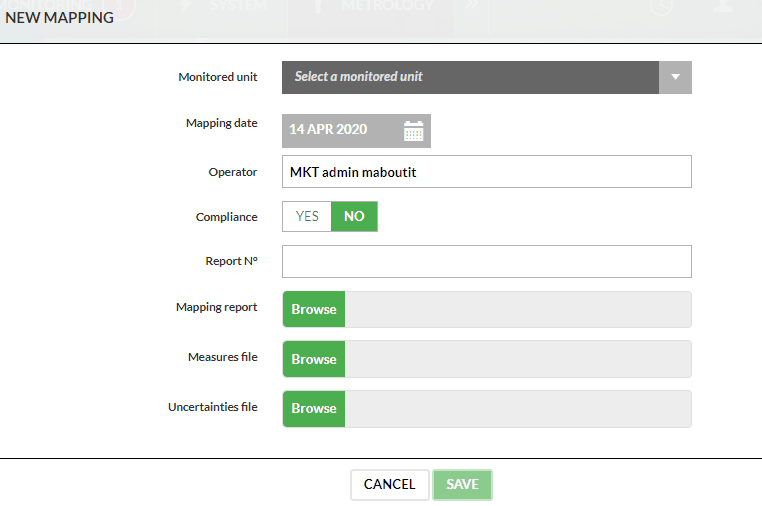
A click on the button ADD NEW MAPPING gives the possibility to add mapping information on a monitored equipement (mapping report, date, compliancy, measuresn stability and homogeneity…)
Once the mapping is added, it’s possible to modify it or add new one by clicking on ADD ou EDIT.
- The number of metrological tasks to renew on the sensors:
By clicking on this indicator displays the list of metrological information of all the sensors. Metrological certificates to be renewed are displayed in blue in the list.
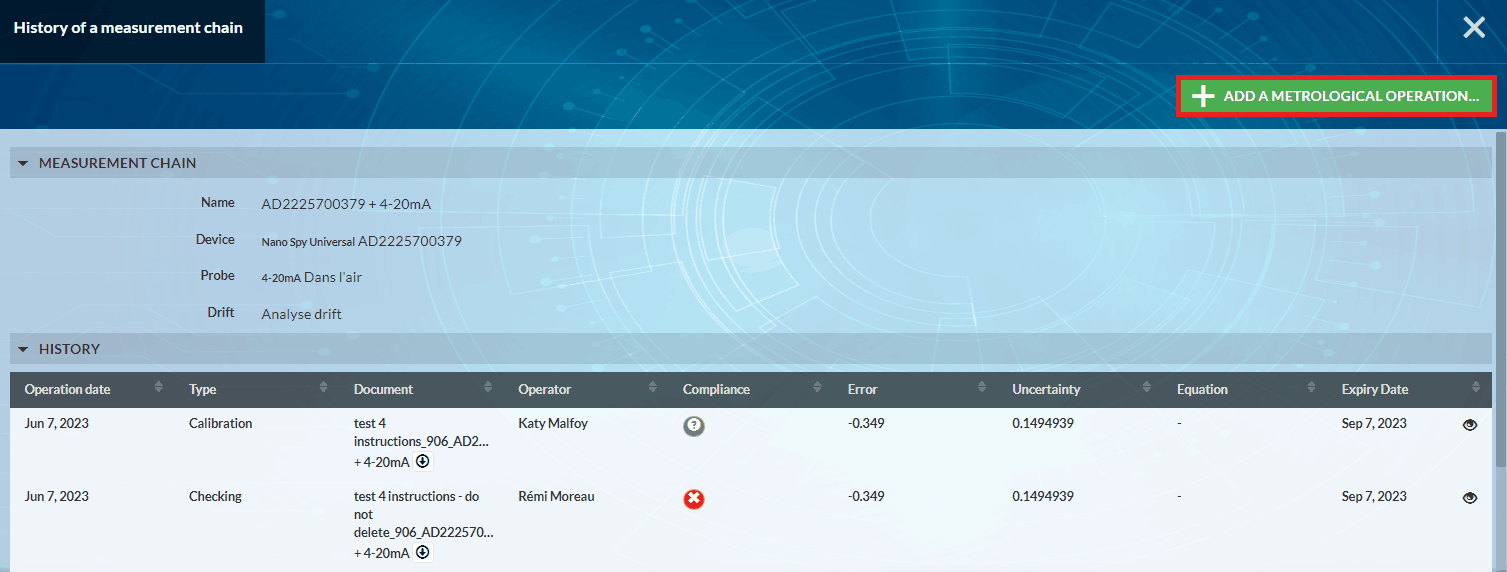
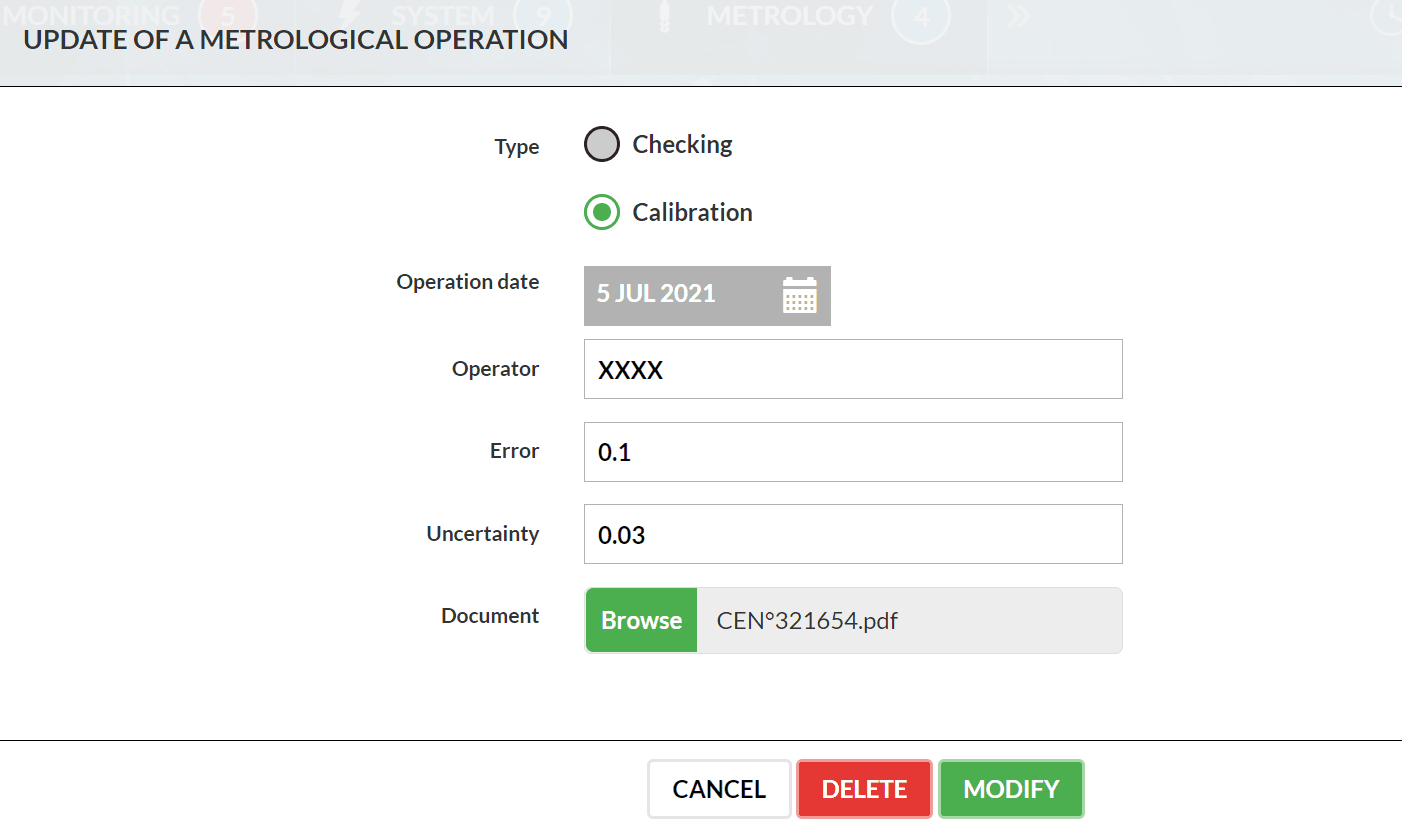
Click on “Add a metrological operation” to manually enter a metrological operation (Type, Date, Operator, Error, Uncertainty, etc.).
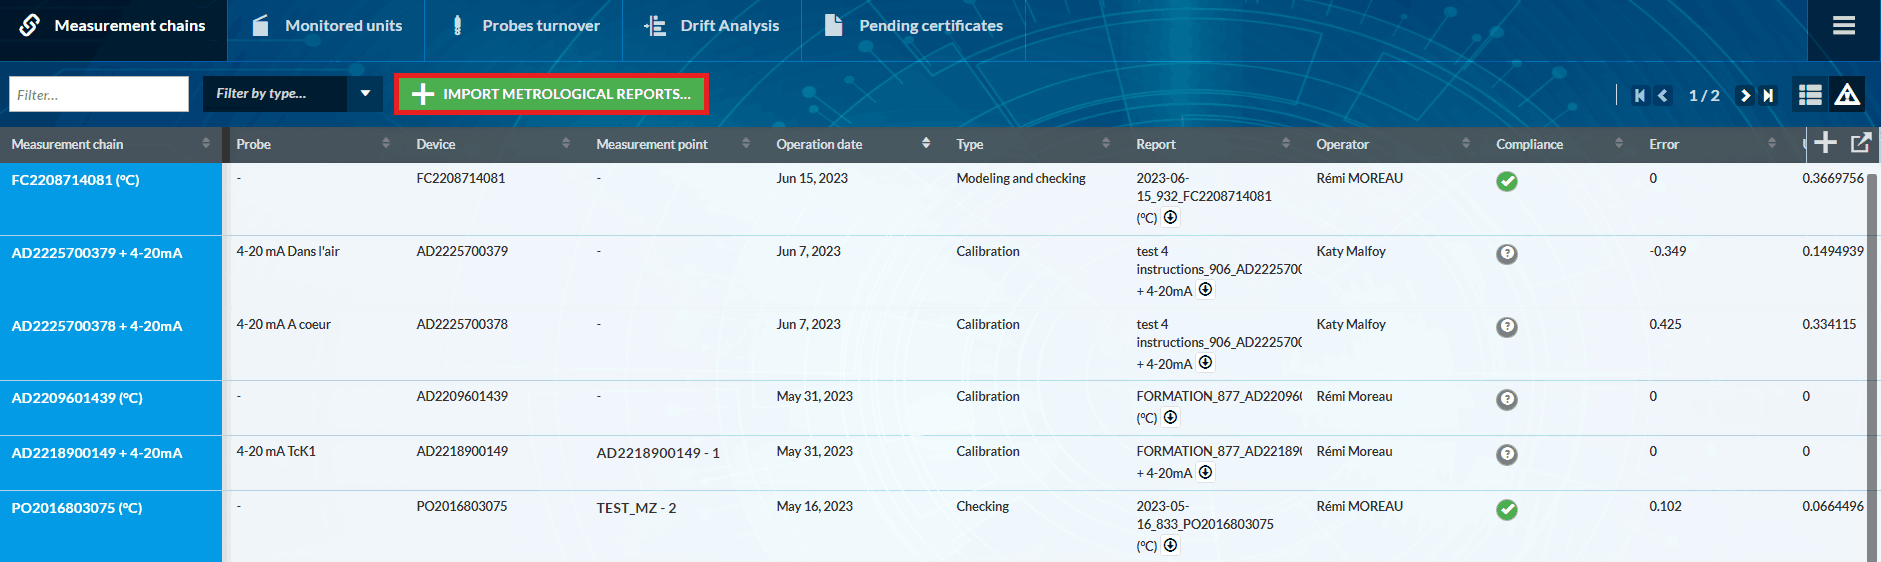
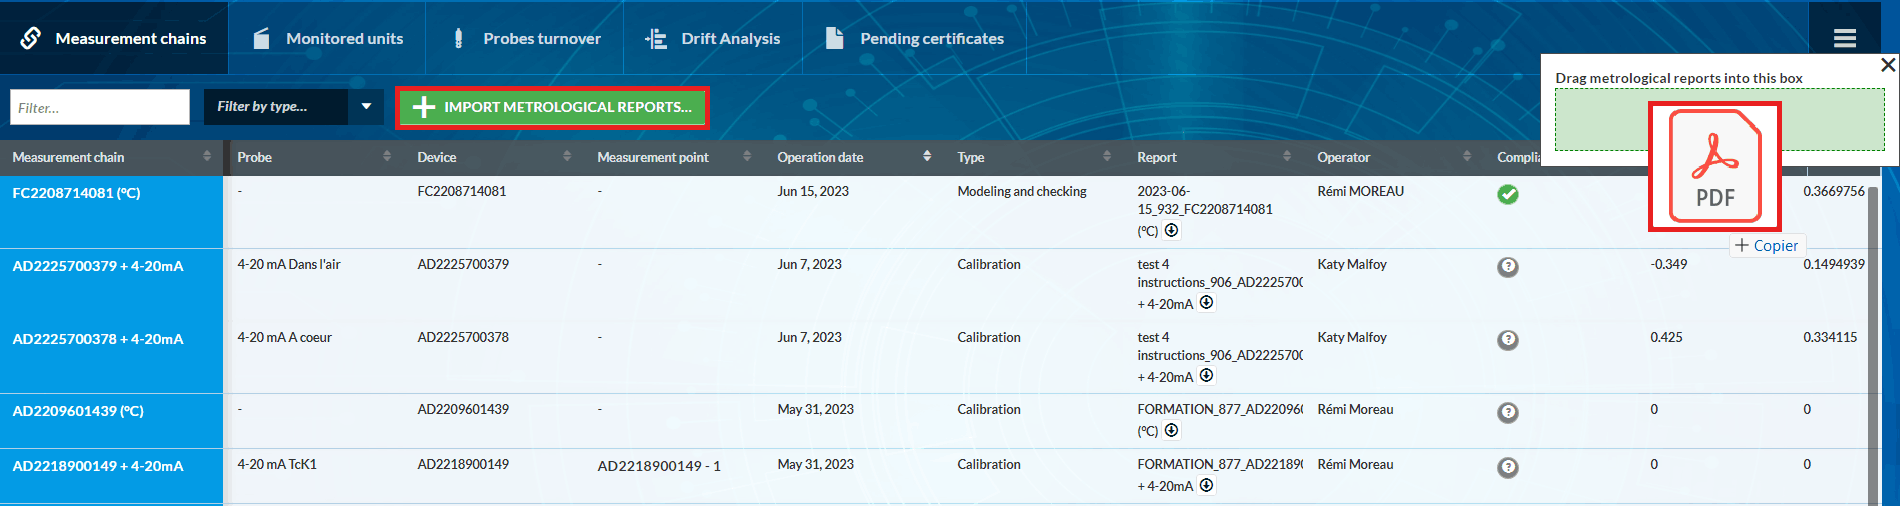
- Import metrological certificates :
JRI metrology certificates can be automatically imported into MySirius CLOUD. However, a manual import function is available for both versions, CLOUD and SERVER. Simply click on IMPORT REPORTS , then drag and drop the reports into the square provided. For customers with the MySirius calibration module, the certificates produced in the CALIBRATION section are accessible for each measurement chain.
Modelization application
When importing (manually or automatically) new COFRAC calibration certificates or verificationreports made by JRI with an error modelization, you can choose whether or not to apply this modelization in order to adjust your measuring chains.
- Following a drag’n’drop: Select a measurement chain and click on “SEND”.
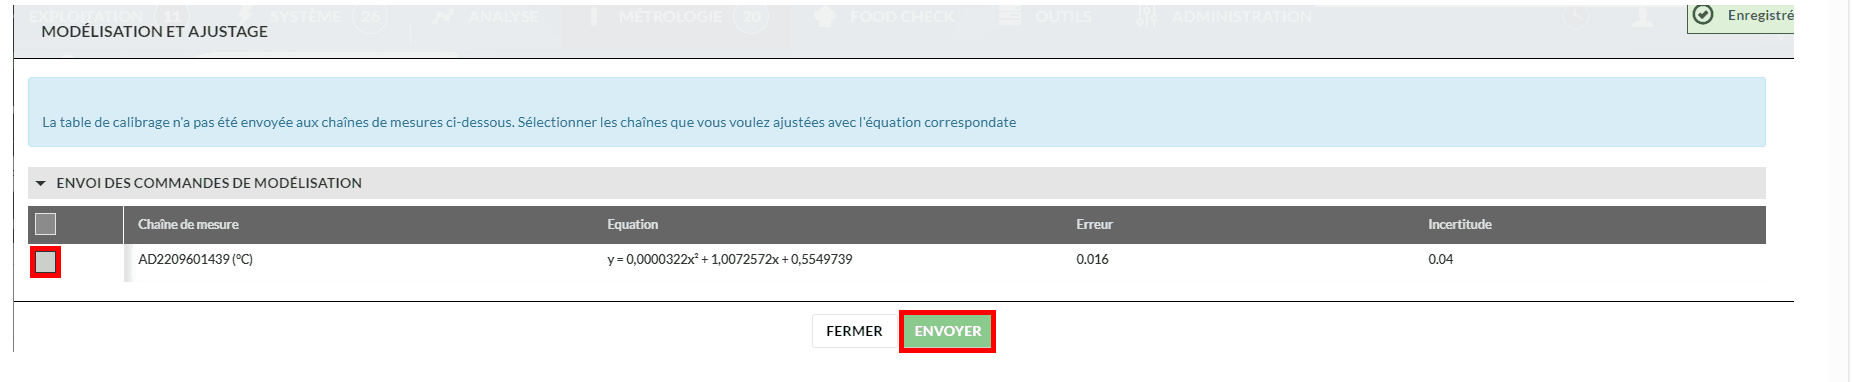
- Following automatic addition: In the measurement chain list, a button opens a window. Select the measurement chain and click on “SEND”.
In both cases, once the modelization has been sent, an adjustment is made on the measuring chains based on the correction parameters of the certificate.
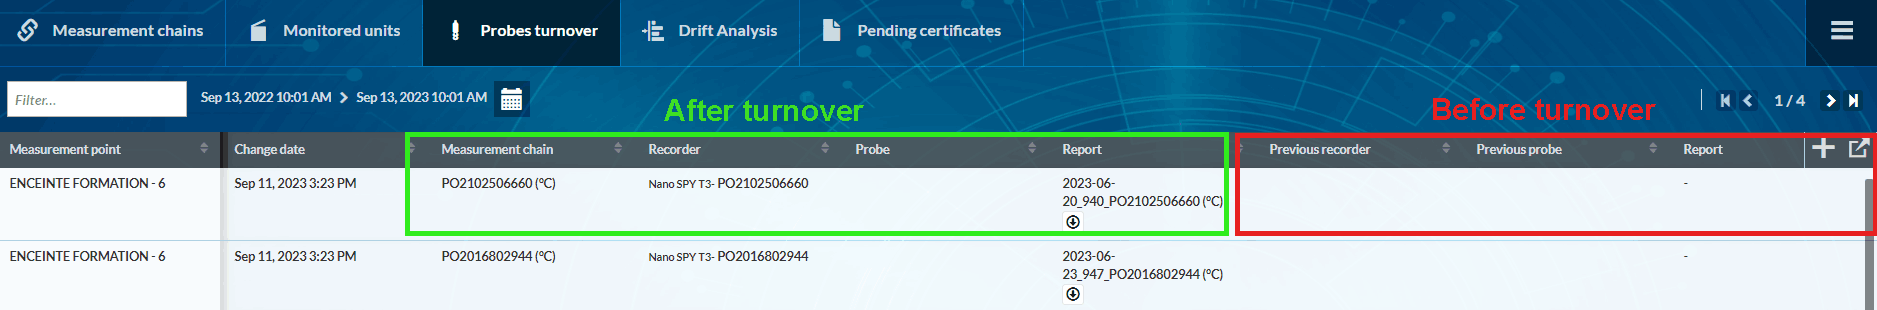
Probes Turnover
This indicator displays the number of measurememnt points on which sensors have been replaced during the last 12 months.
A click on it displays the table bellow:
Drift Analysis
This section will analyze the current drift of measurement chains. The aim is to optimize the rotation periodicity of JRI probes, and to estimate when an adjustment (by modeling) will be necessary on a chain (if error >or< predefined EMT). This estimate is made possible by drift analysis.
Pending certificates
As soon as a metrological operation is ordered on a JRI measurement chain that will be used on the JRI-MySirius cloud, the certificate is available for the customer even if the measurement chain is not yet installed. Once the chain is activated and added to the customer’s site, the certificate no longer appears in this section. It can be seen directly from the table of metrological information of the measurement chains or the details of the metrological operations of a monitored unit.
Self calibration
The “Self-calibration” window lets you manage all self-calibration operations
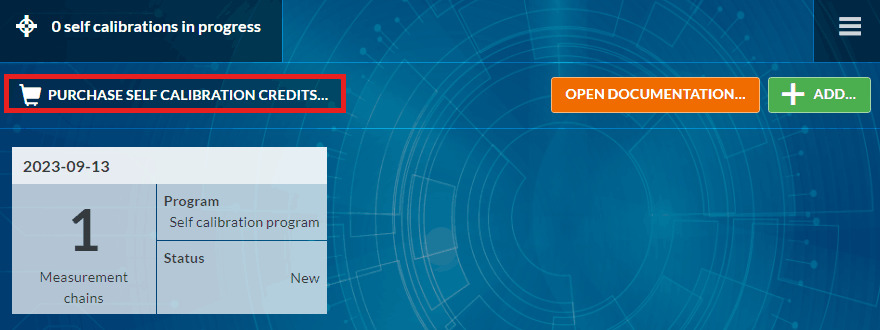
- Self-calibration in progress indicators
- Indicators of number of self-calibration credits remaining
- Order new self-calibration credits
- Create a self-calibration
- Share a reference measuring System
Management of self-calibrations in progress
Find your current self-calibrations by clicking on the “Self-calibration in progress” indicator. Continue your self-calibrations by clicking on one of the thumbnails.
- Add a new self-calibration:

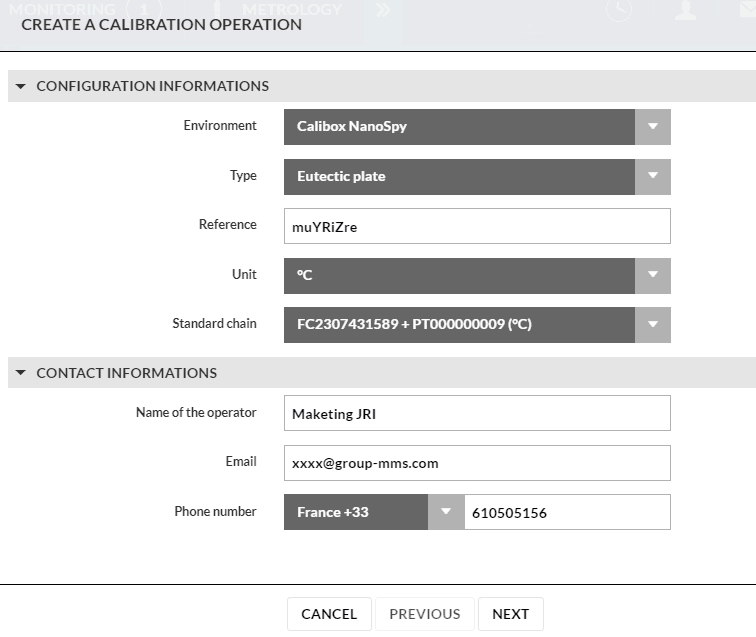
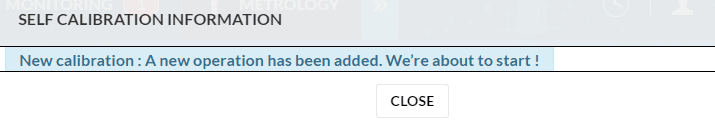
- Create a new self-calibration by clicking on ADD from the “Self-calibration in progress” window, or directly from the + Create self-calibration button on the control panel.
- You can then add calibration configuration information (Environment, Type, Reference, Unit of measurement, Standard chain) and contact information (Operator name, Email, Phone number).
- During the entire set-up, please read the preparation and installation instructions.
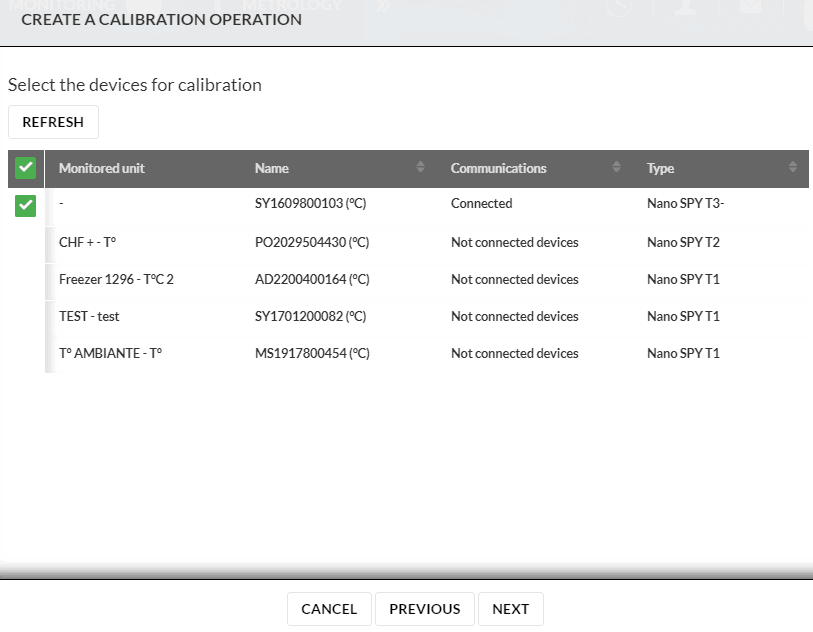
- Select devices to be calibrated
- Launch self-calibration
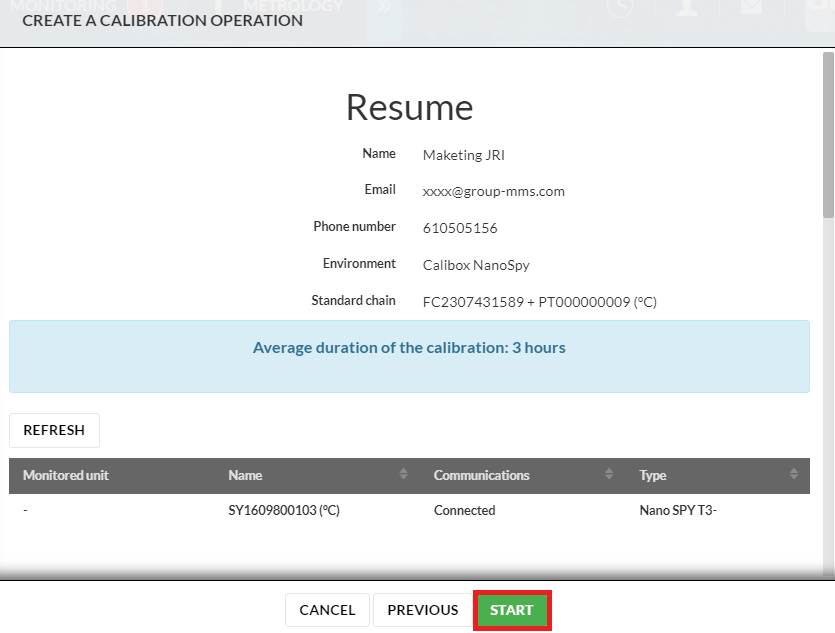
- Once the self-calibration has been completed, the results will be analyzed by JRI’s Metrology Department, which will transmit the results within 48 hours.
- Purchase self calibration credits:
Self-calibration credits can be topped up by clicking on PURCHASE SELF-CALIBRATION CREDITS from the “Self-calibration in progress” window, or directly from the Buy self-calibration packages button on the dashboard.
Select the package of self-calibration credits required (1, 10, 50, 100). To finalize your order, you need to validate the Terms and Conditions of Sale. Once the terms and conditions have been validated, the order button is accessible.
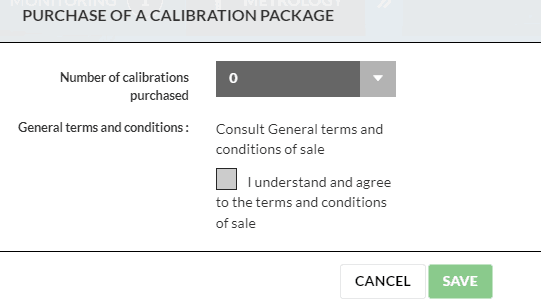
If you are a JRI direct customer, your account will be credited automatically. If you go through an Authorized Distributor, an e-mail will be sent to them so they can make the necessary arrangements.
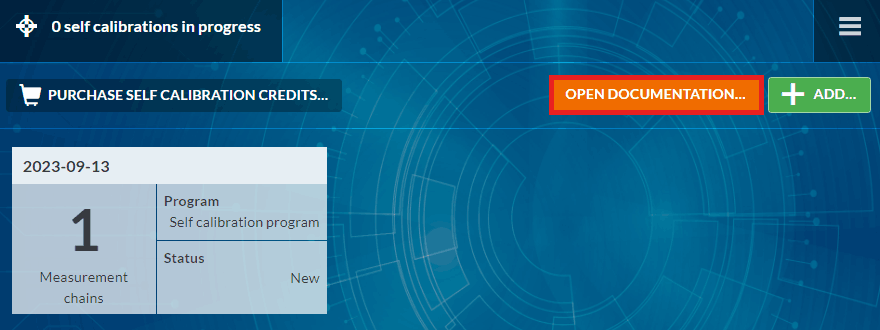
- Consult the Calibox installation guide:
Click on “Open documentation” to access the Calibox JRI installation guide.
- Share reference measuring System:
Share a reference measuring System consists in making this reference measuring system visible and usable by another MySirius account. To share a reference measuring system click on ![]() and to stop sharing it, click on
and to stop sharing it, click on ![]() .
.
Metrology alerts configuration
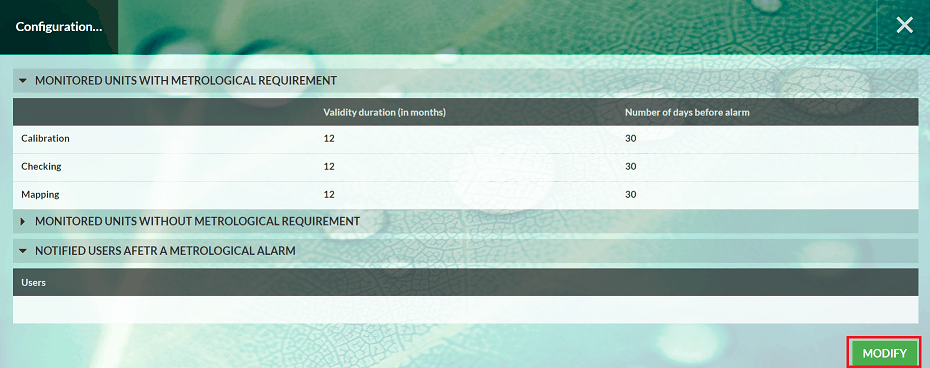
It’s possible to set an alert as a reminder of a close expiry date on a mapping report or a calibration certificate. Click on the button METROLOGICAL ALERTS CONFIGURATION and modify the Validity duration (in months) and the Number of days before alarm.
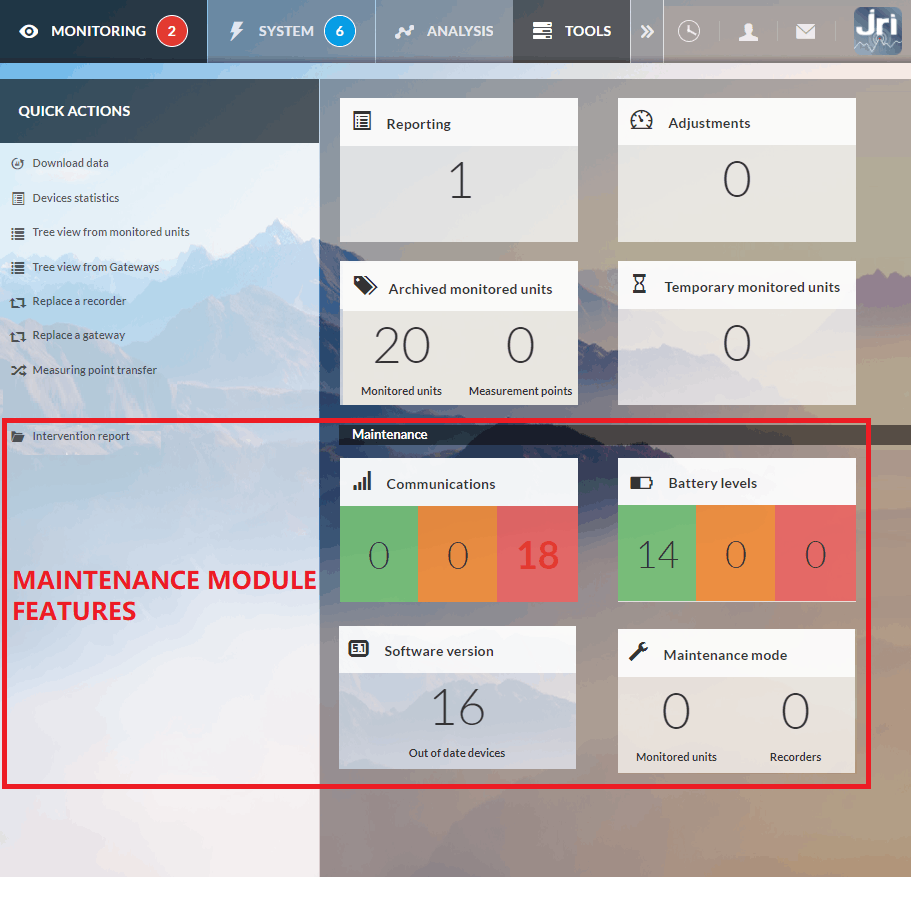
TOOLS tab & MAINTENANCE Module
THE MAINTENANCE/TOOLS TAB is available for all MySirius service levels. It allows the edition and visulization of reports, data from archived monitored units or measurement points. It is also possible to create temporary monitored units to view and export data as part of metrological operations (mapping, calibration, verification)
The MAINTENANCE MODULE is optional, available for all MySirius service levels. It provides more detailed elements to easily manage your fleet communication statistics, battery levels and device firmwares (Nova range & Nano range)
Quick actions menu
This menu is available in the TOOLS tab. It allows some quick actions :
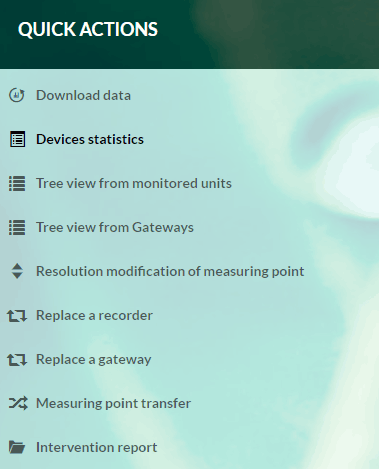
Download Data : (see User guide)
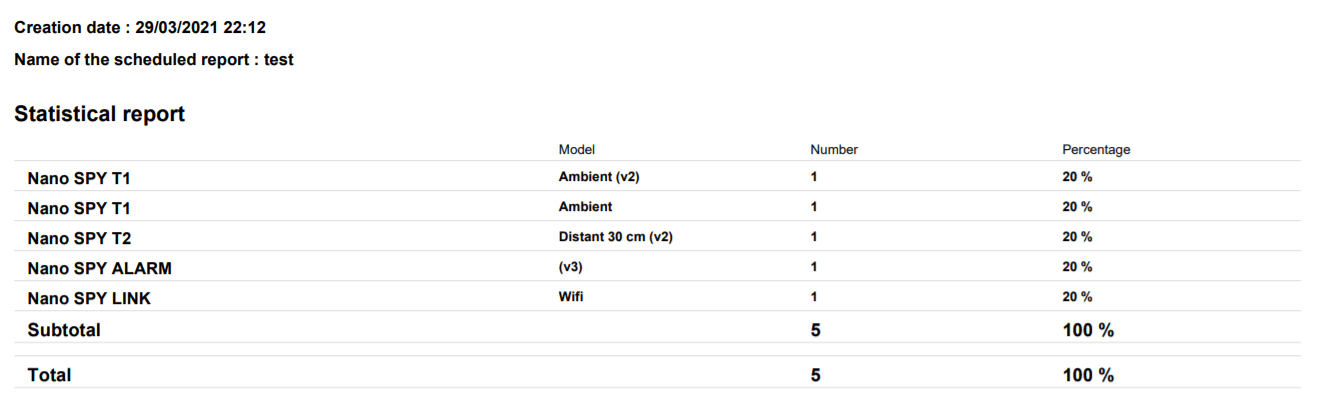
Device statistics : Create a report resenting the composition of your fleet by type of device.
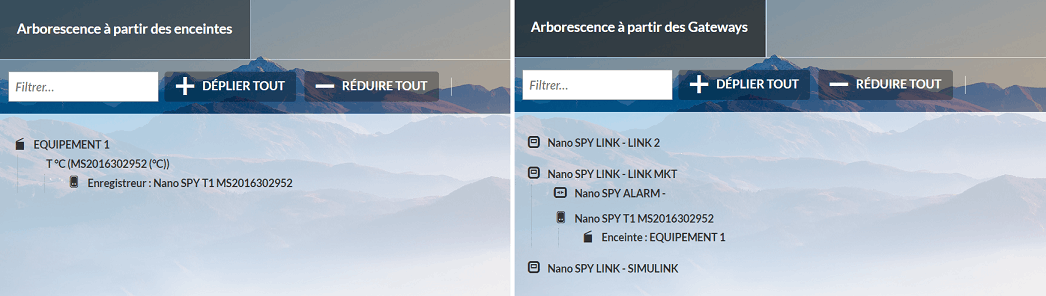
- Tree view from monitored units or Gateways : This display shows the link between the monitored units, the devices used (measurement chains), the RELAY / ALRM modules as well as the GateWays / LINKS which are used for communication. It is possible to export this information in PDF or CSV format.
Resolution modification : Choose the measuring chain and change the resolution (0.1 ; 0.01 ; 0.001)
Recorder or GateWay exchange : These 2 functions allow a simplified replacement of one recorder by another during curative or preventive maintenance operations without affecting the configuration of the monitored unit. Exchange is only possible between compatible devices (A Nano T1 can be replaced by a T1 or T2 for example, but not by a LORA TH). The replacement of GateWays / LINKs is simplified and induces the automatic modification of the alert means if used in cascades.
Measuring point transfer: It is possible to transfer a measurement point (configuration and measurements) from one unit to another. All you have to do is choose the unit, the measurement point and the destination unit.
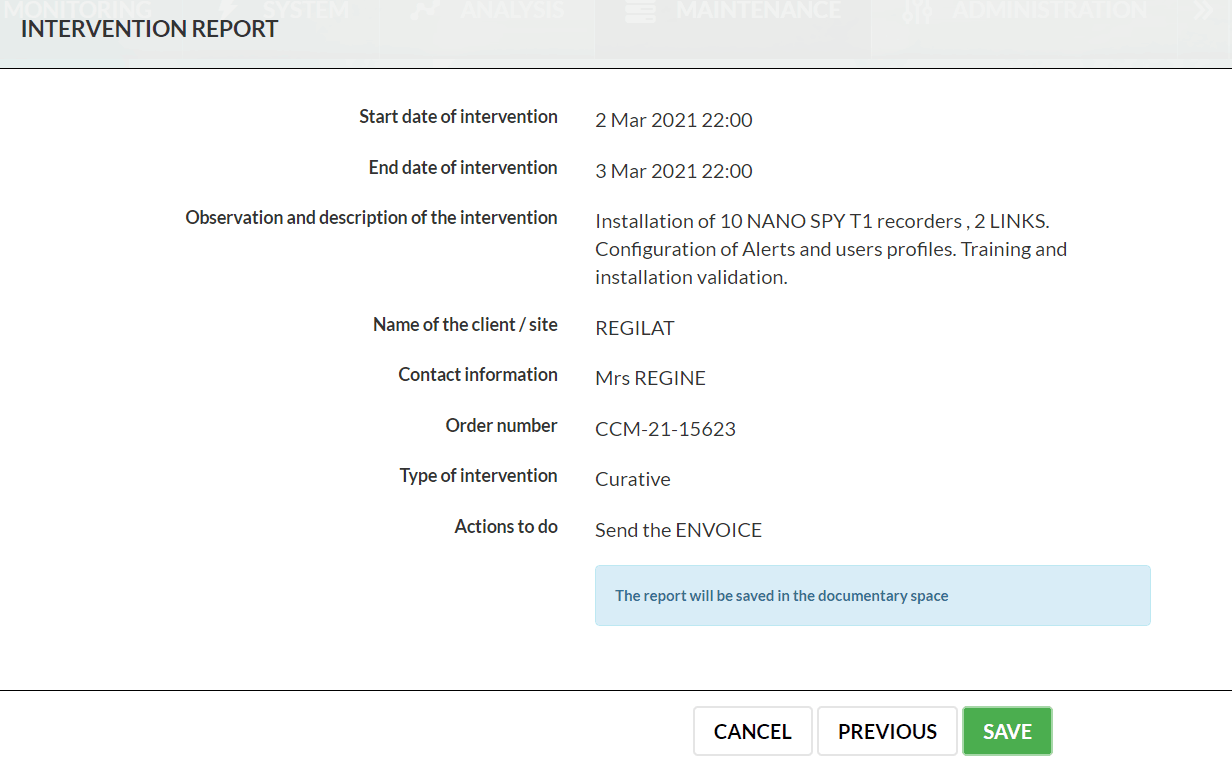
Intervention report (voucher) : Upload or edit a report with the details of an intervention in order to send it by email or integrate it in “MY DOCUMENTS”
Reporting
- Reporting management (see section REPORTING in the user guide)
Proceed to an Ajustement
To adjust (set an offset) on a measuring chain (only for Nova, Nano and LoRa recorders with built-in sensors):
- Select the measuring chain to adjut
- Click on adjust
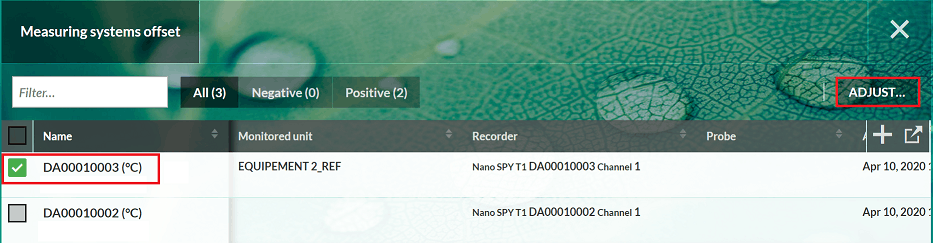
- Enter the offset value (positive or negative value)
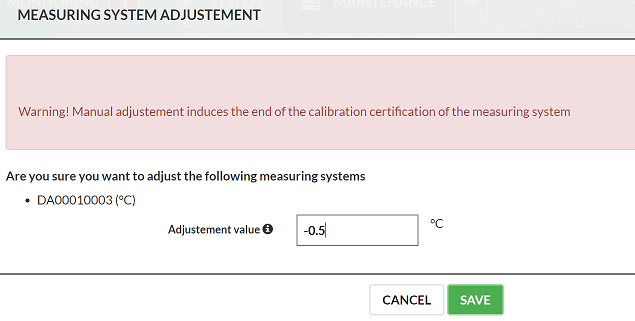
A click on a measuring chain displays the list of all previous adjustement operations.
Archived
See section Maintenance module in User guide
Temporary monitored units
Temporary monitored units are used to generate data for mapping and test purposes.
For all Nova SPY’s version and from version 4.0 of of the Nano SPY, it is possible to use the fast recording mode to take sub-minute measurements. It is not recommended to use this mode over a long period of time as it significantly reduces the battery life of the device.
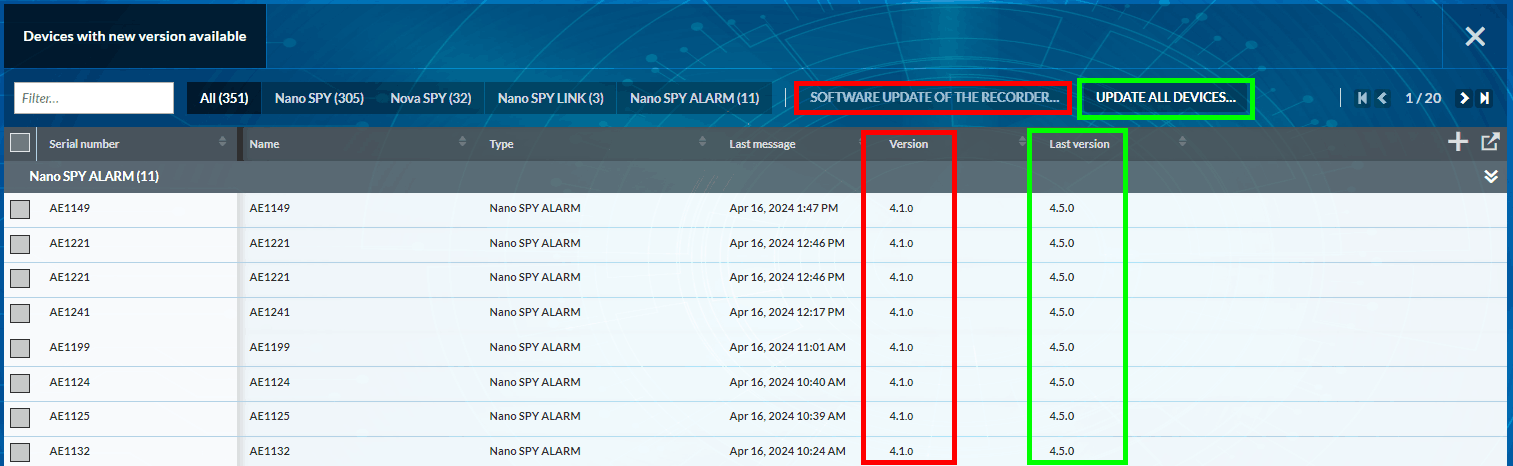
Software Version (Software upgrade only for Nova SPY & Nano SPY range)
This tile shows the number of devices whose firmware version can be updated. MySirius displays the current version of the device and the version available for update.
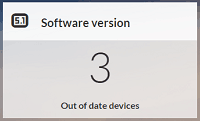
** Upgrade procedure on MySirius Cloud:** firmwares are uploaded by JRI. Simply select the list of devices to be updated and click on the “UPDATE DEVICE” button. You can update the entire fleet by clicking on the “UPDATE ALL DEVICES” button. Devices can be filtered by category.
** Upgrade procedure on MySiriusSERVER:** - Contact JRI support (support@group-mms.com) to get the firmware files (.nrm) - Open the MySirius installation directory (by default C:/JRI/MySirius ) - Create the directory “C:/JRI/MySirius/Firmware” and open it. - Create a directory “Nano” or “Nova” which must contain the file “SNR_11.nrm” (software of the Nano SPY or Nova SPY). - As the version number of each software is written in the Web.config file, it is necessary to update the information of the soft versions registered in it to be able to carry out the update via the SOFT VERSION tile of the MAINTENANCE tab.
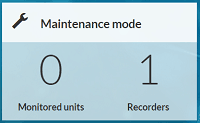
Maintenance Mode
A monitored unit or a recorder can be set into maintenance mode in MySirius (with a deadline and reason) during corrective intervention on the monitored equipment or the device used for monitoring. Select the mnitored unit or the recorder and click on MAINTENANCE. This operation stops alerts and measurements sending to MySirius. Monitored units and recorders undergoing maintenance are identified by a yellow / black colour in the OPERATION / ADMINISTRATION tab.
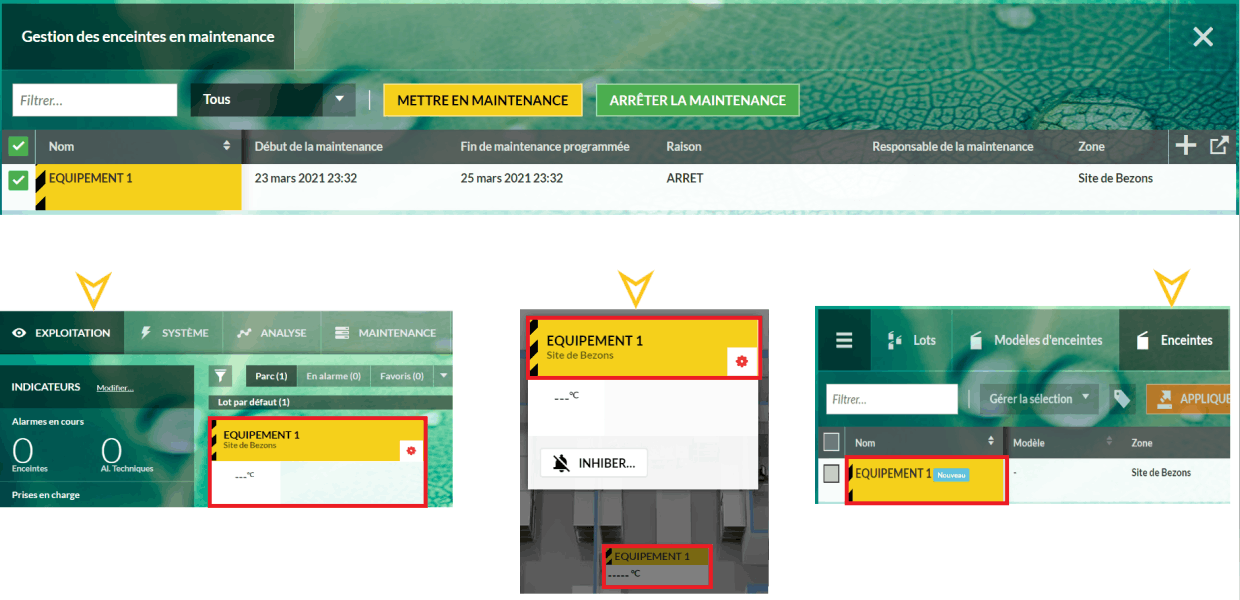
Setting back a unit to OPERATIONAL mode is done by clicking on the STOP MAINTENANCE MODE button.
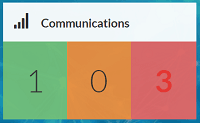
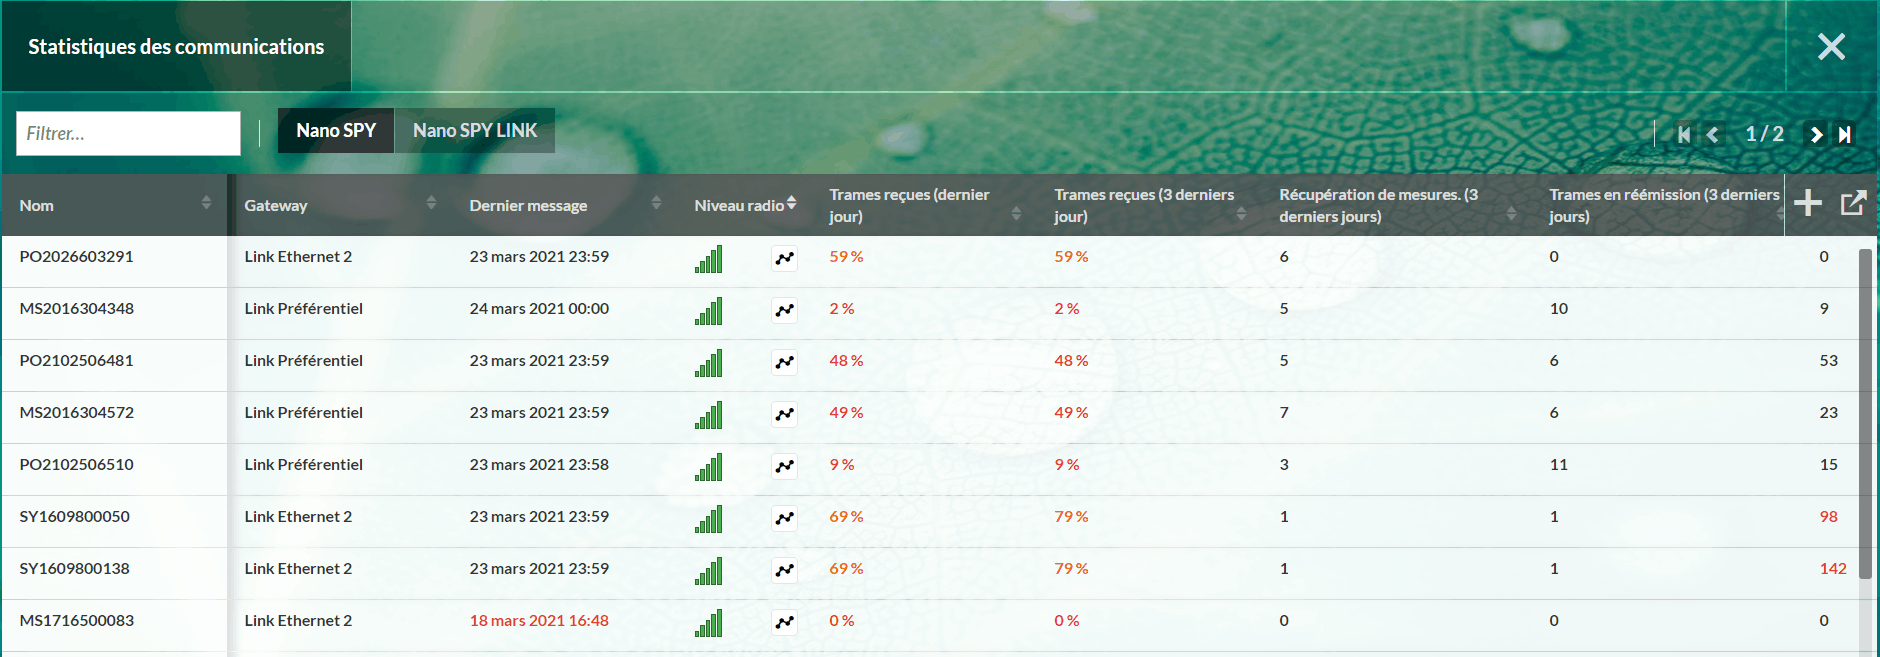
Communication Statistics
This tile gives access to the communication statistics table. It displays the radio level and the number of measurements retrieved, for example, which are key indicators for a proper functioning of a measurement chain. This list is exportable. Values colour changes from black to orange then to red depending on the statistics.
Battery level
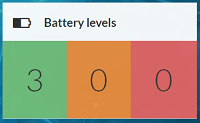
This tile gives access to the details of devices battery levels. The battery level of each device is updated in real time within each communication. Sorting can be done to display critical battery levels ≤ 40% to organize battery change campaigns. This list is exportable.
From version 3.0 upwards, you can enter the battery change date by selecting one or more devices and clicking on BATTERY CHANGE.
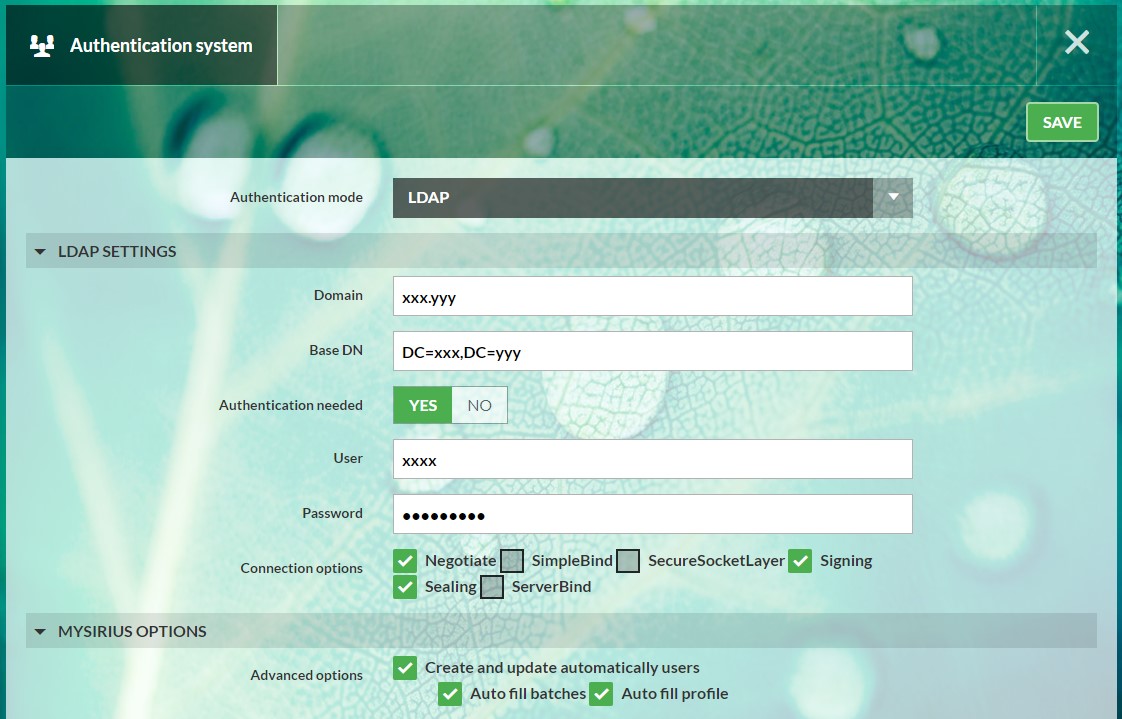
LDAP (Active Directory) Module for MySirius SERVER
This function can only be activated on MySirius Server and must be ordered before installation. It’s a configuration parameter used to activate users management by an LDAP (Active directory or other).
This feature is used to manage user authentication (password verification). Depending on the options activated, it is also possible to manage the automatic creation of users and the rights of the user’s profiles.
Operating diagram
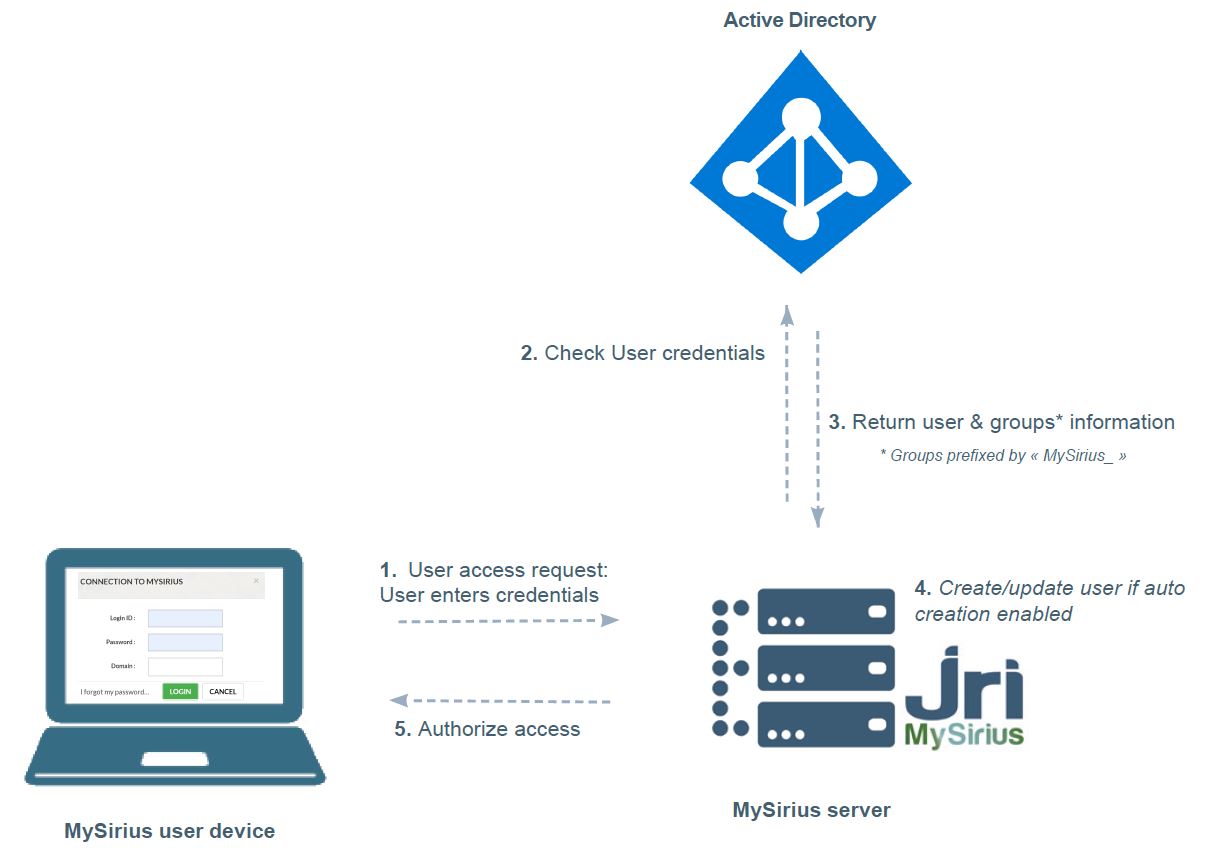
LDAP configuration
- Use DISTRIBUTOR’s login or general administrator account created on the setup of MySirius.
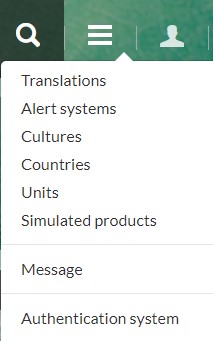
- Open options Menu and select AUTHENTIFICATION SYSTEM
- Enter the required information provided by the customer’s IT and click on “SAVE”
- Select the optionnal features accoing to the customer’s needs
- Restart MySirius services to apply changes on your installation.
Users accounts management prerequisites
- If the automatic creation is disabled you have to :
- Either manage users manually (create/modify) via MySirius
- Or develop a synchronization application that will communicate with the Connectivity module
- If automatic users accounts creation is enabled:
- Make sure you have the following users information in the customer Active Directory:
- First name
- Name
- Login
- Email address
- MySirius profile : can be managed via an AD group - if the option is enabled:
- Administrator: MySirius_Profile_Admin
- BAtch Manager: MySirius_Profile_BatchManager
- Simple user: MySirius_Profile_BatchUser
- Metrologist: MySirius_Profile_Metrolog
- Customized profile: MySirius_Profile_profile name
- Otherwise If disabled, the user is created with the simple User profile
- List of MySirius batches : can be managed via AD groups - if the option is enabled:
- Format: MySirius_Batch_nom of the lot
- Otherwise, if the option is disabled, the default batch is assigned to the user (unless it is an administrator, in which case it will have access to all batches)
- Make sure you have the following users information in the customer Active Directory:
Compatibility with LABGUARD solution (from MySirius 3.0)
From version 3.0 of MySirius, the control of the LABGUARD solution has been made possible through the use of an access point.
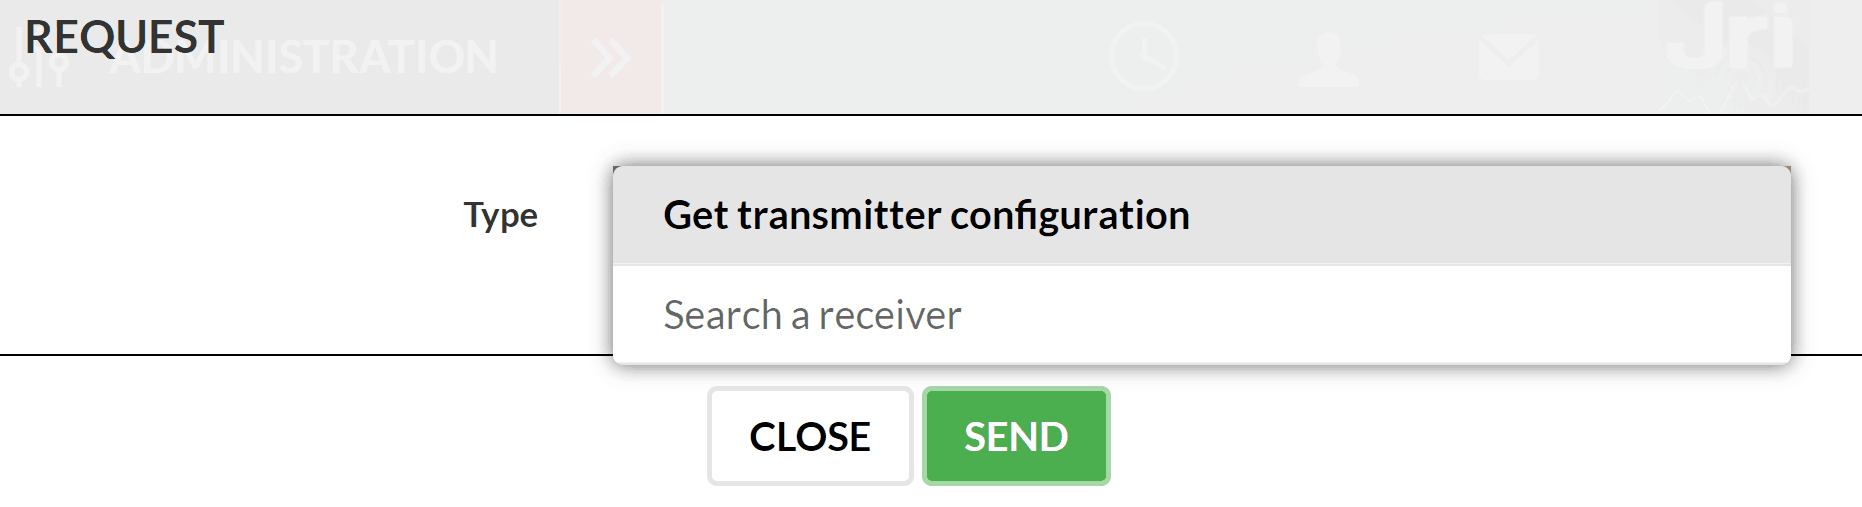
Configuration of a transmitter
The configuration of a LabGuard transmitter is done from the RECORDERS tab in the ADMINISTRATION menu.
- To open the configuration menu, click on the button

- Check the parameters to be activated and click on “SEND”.
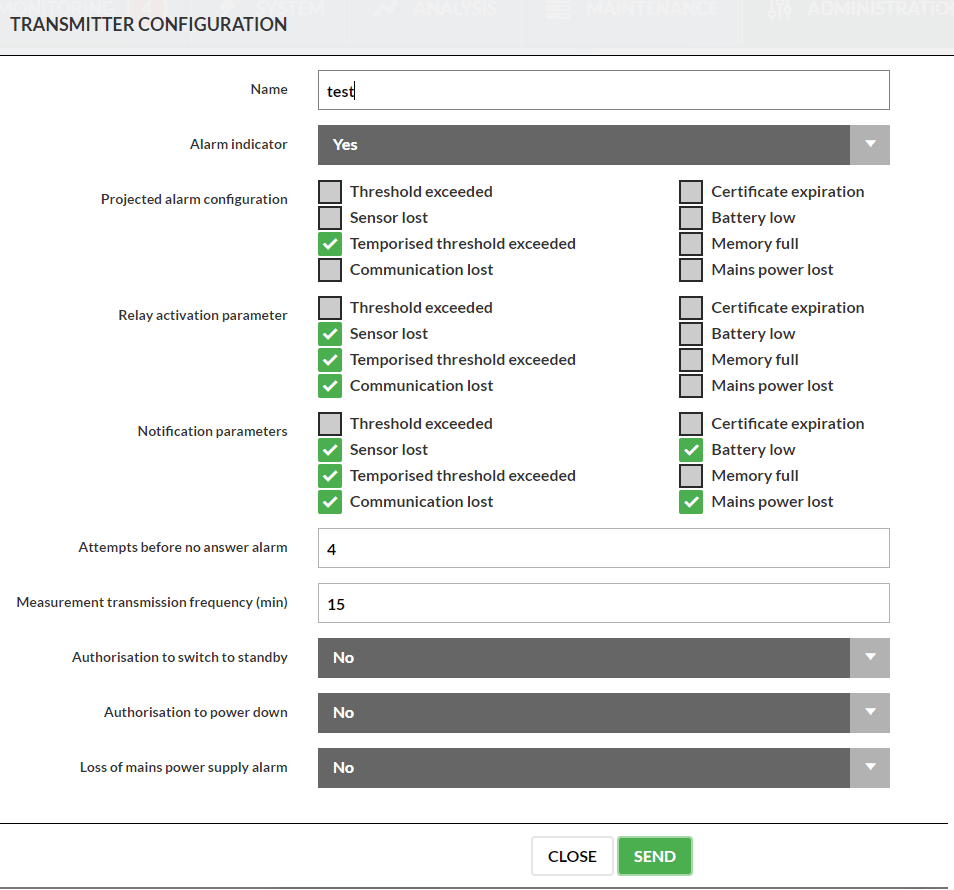
- The button
 allows to send requests to a sender.
Operating and alarm schedule
For each monitored unit by a LabGuard or nano Spy device, it is possible to define an operating and alarm schedule.
- Go to the configuration sheet of a monitored unit and select YES for the “MONITORED UNIT WITH SCHEDULE” parameter.
- Customise the weekly schedule displayed. It is possible to divide a day into several time slots using the sliders 🔻.
- Enable/disable the measurements recording on a period by clicking on it
- Grey areas = No rmeasurements recording and no triggering of alerts (thresholds / techniques)
- Green zones = Measurements recording with management of alerts
- Zones with programs P1, P2, P3 = Triggering of alarms according to the thresholds and delays defined in each program
- Zones with alarm inhibition = Inhibition of alarms.
- Set the alert programs (criticality, thresholds, time delay…etc) for each measurement point:
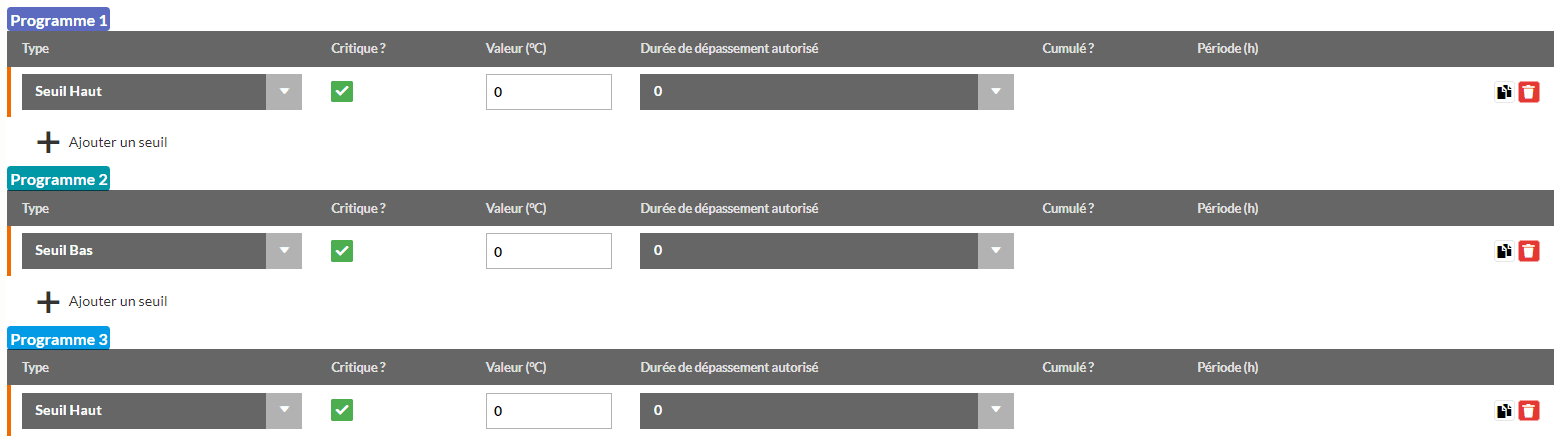
Measurement uncertainty
The measurement uncertainty and/or the calibration error can be integrated in the configuration of the alarm thresholds. In the measuring point, you can now choose to apply the uncertainty, the uncertainty + error or a manual value. This choice is applied to the thresholds.