Definitions
Unit / Monitored unit
A monitored unit is an equipment, an enclosed space monitored by one or several measurement point(s) (ex.: cold room, incubator, refrigerator, freezer, building…)
It is possible to give it a name, an inventory number (optional) and a “Special metrological requirement” indicator if there is a need to trigger a metrological alert before the end of validity of the calibrations or mappings related to this unit. An operating schedule can be applied with customized monitoring periods (with or without triggering an alert).
To exist in JRI MySirius, a monitored unit needs to have at least one measurement point.
Archived Monitored Unit
An archived monitored unit is no longer in use in the system. It’s not shown and managed in the MONITORING or ADMINISTRATION tabs. We keep the possibility to see its measurement points configuration and Data in the MAINTENANCE tabs , tile ARCHIVED MONITORED UNITS. It is possible to put an archived monitored unit back into operation by unarchiving it. Deleting an archived monitored unit erases definitely all data and measurements from the MySirius database .
Temporary Monitored Unit
A temporary monitored unit is a virtual device used to generate and export measurements as part of metrological services such as mapping or calibration.
Measurement point
A measurement point is the area of the monitored unit where the measurements of a physical quantity are performed. At least one measurement is required to be positioned in a monitored unit but there can be several measurement points in a monitored unit.
In a monitored unit, the measurement point(s) receive all information regarding the configuration: measurement units, recording frequencies, alarm thresholds…
Each measurement will be thus linked to a measuring point.
A measurement point uses a measurement chain to carry out the measurements.
Computed measuring point
A computed measuring point is the display of a value calculated from 2 measurements from 2 different sensors.
Virtual Measurement point
A virtual measurement point allows the simulation of T° values using the real measurement point readings. This is done by an algorithm to be specified for each product type.
Measurement chain
A measurement chain is a group consisting of a measuring device (sensor) and a device which processes the measurements in order to supply useable values for display or recording.
A measurement chain can be composed of a complete device with integrated probe (non exchangeable) or a device and an external probe connected to the device (plug-in or not).
Metrological operations (calibration, adjustment, and verification) are performed on the measurement chains.
A measurement chain must be linked to a measuring point for the measurements to be accepted by JRI MySirius.
Monitored Unit model
A monitored unit model enables the simultaneous creation of several identical units in terms of:
- the number of measurement points,
- the configuration of these measurement points.
It contains much of the same information as a monitored unit with the following exceptions:
- it is not placed in a zone by default,
- it belongs to no batch,
- it is not linked to one or several measurement chains in particular but to one or more types of measurement chains.
Zone
A Zone is a geographic localization in which the monitored units can be «physically» placed.
In JRI MySirius, the user can define, as he wishes, the geographical organization of his installed base. To do so, he can create a tree view where each level corresponds to: a site, a building, a level (floor), an area, an office… Each part or subpart of the tree is considered as a Zone. It’s possible to add and link a MAP to each Zone.
Each level of the tree view can be named and identified. There’s no limitation in the number of created zones.
Example :
- Domain (JRI),
- Site 1 (Fesches-Le-Châtel)
- Metrology
- RM office
- Laboratory
- Engineering
- Electronic Development Department
- Software Application Development Department
- Metrology
- Site 2 (Bezons)
- Marketing
- Export
- Site 1 (Fesches-Le-Châtel)
User
A user is a person who can connect to JRI MySirius.
A user can only have access to data from the domain belonging to him. He has a profile which lets him know his rights (ex.: the right to add a device, the right to acknowledge an alarm…). His actions are limited by his rights.
Each user has personal data (first and last names, email, telephone number…) and manages his weekly schedule and his lists of alert means (email, sms, voice call) to be used in the event of an alarm. He must fill them out to guarantee the correct functioning of JRI MySirius.
A user can have access to a certain number of batches in which are placed the monitored units he wants to see. He can define a home page by default which is displayed at each of his connections. This home page is modifiable in his profile
The user is also assigned to an area of the geographical organization of the domain which allows direct access to the monitored units which are assigned to him.
Batch
A Batch is a group of units that enables the organization of the monitoring system. There is no limit on either the number of batches or the number of units per batch.
A batch can contain units from several different zones and a monitored unit can belong to several batches.
Each «Domain» has a default batch named «default batch» which cannot be deleted but which can be renamed.
A monitored unit is required to be in a batch. When a monitored unit is created, it is automatically placed in the batch. It can subsequently be assigned to other batches.
Technical batches
Technical batches intend to group technical devices which are not directly linked to a monitored unit: equipment for communication, relay, alarm…
Threshold alarms
Allowed overrun duration
This concerns the duration of a threshold overrun acceptable by the monitored products before an alarm is triggered. In other software, this notion is also called « Alarm delay ».
- Allowed duration of continuous overrun
An alarm with an « allowed duration of continuous overrun » is triggered when the measured value remains above a threshold during the entire defined time duration, without interruption.
The allowed overrun duration is reinitialized if the measured value returns to normal before the end of the countdown.
The allowed overrun duration (delay) is a multiple of the measurement frequency of the measurement point.
Allowed cumulative overrun duration
An alarm with a « cumulative overrun duration » is triggered when the sum of the different overrun durations for a given threshold exceeds the defined time duration over a given recording period (sliding period):
Ex: Authorized overrun duration = 1h over a 24h period.
The alarm will be triggered when the measurement point exceeds the threshold for more than 1h (by a single occurrence or « x » occurrences) over the past 24 hours.
- The authorized overrun duration is set by default to be continuous; if a cumulative duration is desired, this must be specified.
- A maximum duration of alarm treatment (sliding period of cumulative threshold overruns, example: 1 hour of overrun over 24h, 1 week…)
MKT Threshold
A MKT overrun alarm is triggered when the MKT calculated over a sliding period defined by the user exceeds the defined threshold value.
Threshold criticality
For each threshold, the user can define whether or not it is critical. This allows the differentiation between critical and non critical thresholds for the notification of the different persons in the alert management.
Technical alarms
A technical alarm is an alarm which involves the equipment, as opposed to threshold alarms which apply to performed measurements.
Among the technical alarms are those related to the state of the battery, a sensor problem, a communication problem… but also other alarm types such as metrological or maintenance alarms.
- Battery alarm: The energy level of the device batteries is continuously monitored by JRI MySirius. As soon as the value passes below 40% remaining energy, the device enters the technical alarm and flashes blue. The treatment of the technical alarm is then managed by JRI MySirius.
Sensor error: The devices are capable of detecting the integrity of their sensor(s). If they detect an error, they send a technical alarm message to JRI MySirius which triggers a technical alarm and displays it on the screen (see technical alarm management)
Sensor error: The devices are capable of detecting the integrity of their sensor(s). If an error is detected, they will send a technical alarm message to JRI MySirius which triggers a technical alarm and displays it on the screen (see Alarm Management)
Communication error : Communication errors are managed and detected by JRI MySirius, which detects an absence of received data. Activation allows notification when this situation occurs, providing assurance that all the measurements are correctly transmitted. To activate (see General preferences
Time zones
The date/time of the measurements will be displayed according to the time zone defined when the client account was created. It is possible for a user to modify his time zone according to the country from which he wishes to view the measurements.
For example, if a client in Paris displays his data from New York, the date/time on the measurements will be those of Paris by default, unless the user customizes his time zone.
User Interface
The navigation pages of MySirius are composed of different zones
 The menu bar
 Window body
The menu bar
The menu bar is present on all pages of the MySirius application

The menu bar contains:
- The different modules of the base pack («Exploitation», «System», «Analysis», «Administration») as well as all optional modules which have been activated. Each module will be visible only if the user has access rights (ex: A user profile cannot access the “Administration” module). To see the modules which are not visible, click on ‘’>>’’
 A «Clock» button to see the requests which have been treated or are to be treated. The appearance of the button changes as a function of the state of the requests:
- Static: No request in progress
- Animated: A request is in progress
- Red: The last request has failed
 A «profile» button allowing access to the pull-down menu account management
 An «envelope» button allowing access to the integrated message service to send a message to another user.
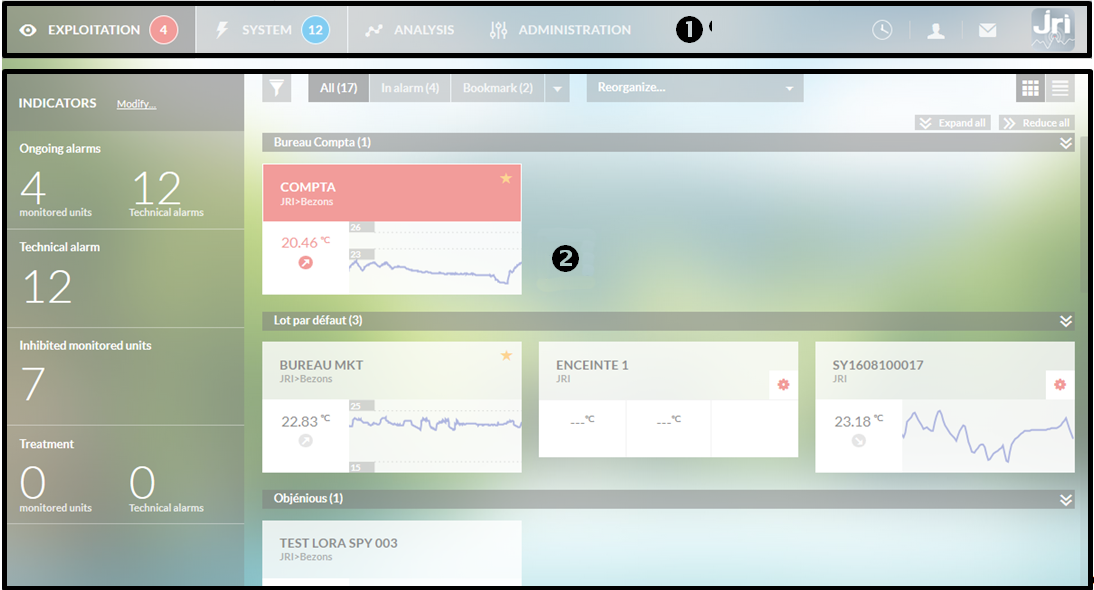
The window body
The menu bar can change its appearance depending on the modules selected from it. For «Exploitation», «System», and «Analysis», accessible to all users whatever their profiles and rights, the window body looks like this:
List of indicators, devices or units.
Action bar for the selected module.
 Display of the selected action
Application access
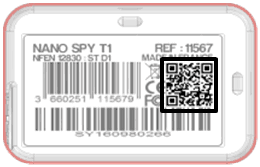
MySirius is accessible at the following address : http://www.jri-mysirius.com
Or by scanning the QR Code located on the label of one of the devices of the Nova SPY, Nano SPY or LoRa® SPY product range
The home page opens
Each MySirius user possesses a login ID, a password and a domain membership. In the event of the loss of his password, the user can request a new password.
The MySirius home page allows authentication in order to access the application but also to create an account after reception of the material.
Customers who have acquired ready to use (prepaid solutions) can create their account directly from this page by clicking on “Create My Account”
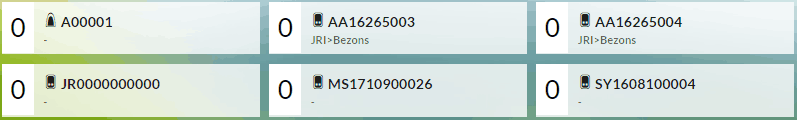
Once authenticated, all users are directed to the dashboard on the “Operations” page except the supervisors. As their profile allows, supervisors can track different sites or facilities. Once authenticated, these users enter MySirius on a page showing all the sites they supervise.
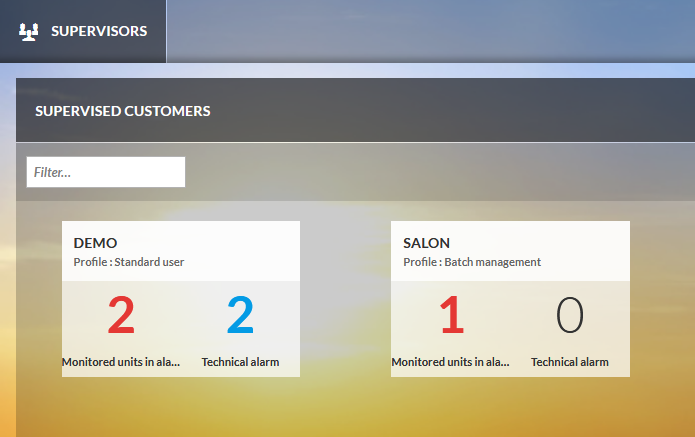
Each vignette represents a supervised site and indicates:
- The name of the site
- The profile and rights that the supervisor will have when entering the site
- The number of threshold alarm and technical alarm of the site
A click on a vignette opens the site in the page “Exploitation”.
«Monitoring» menu
 From the «Exploitation» menu one can view the monitored unit values, identify the number of currently occurring threshold alarms and treat them.
 Number of currently occurring threshold alarms
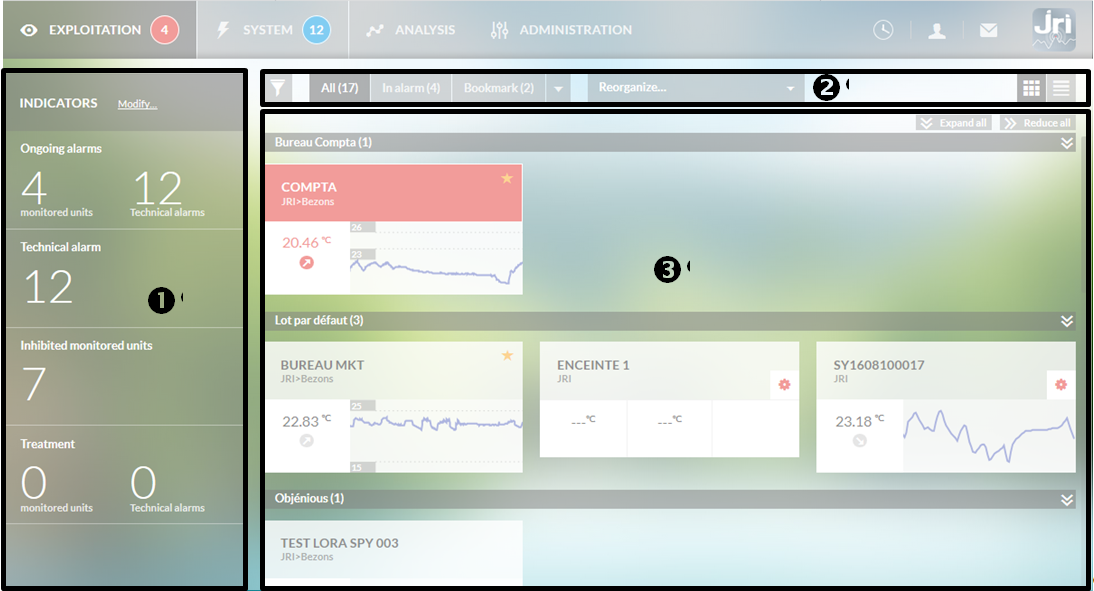
The page is divided in 2:
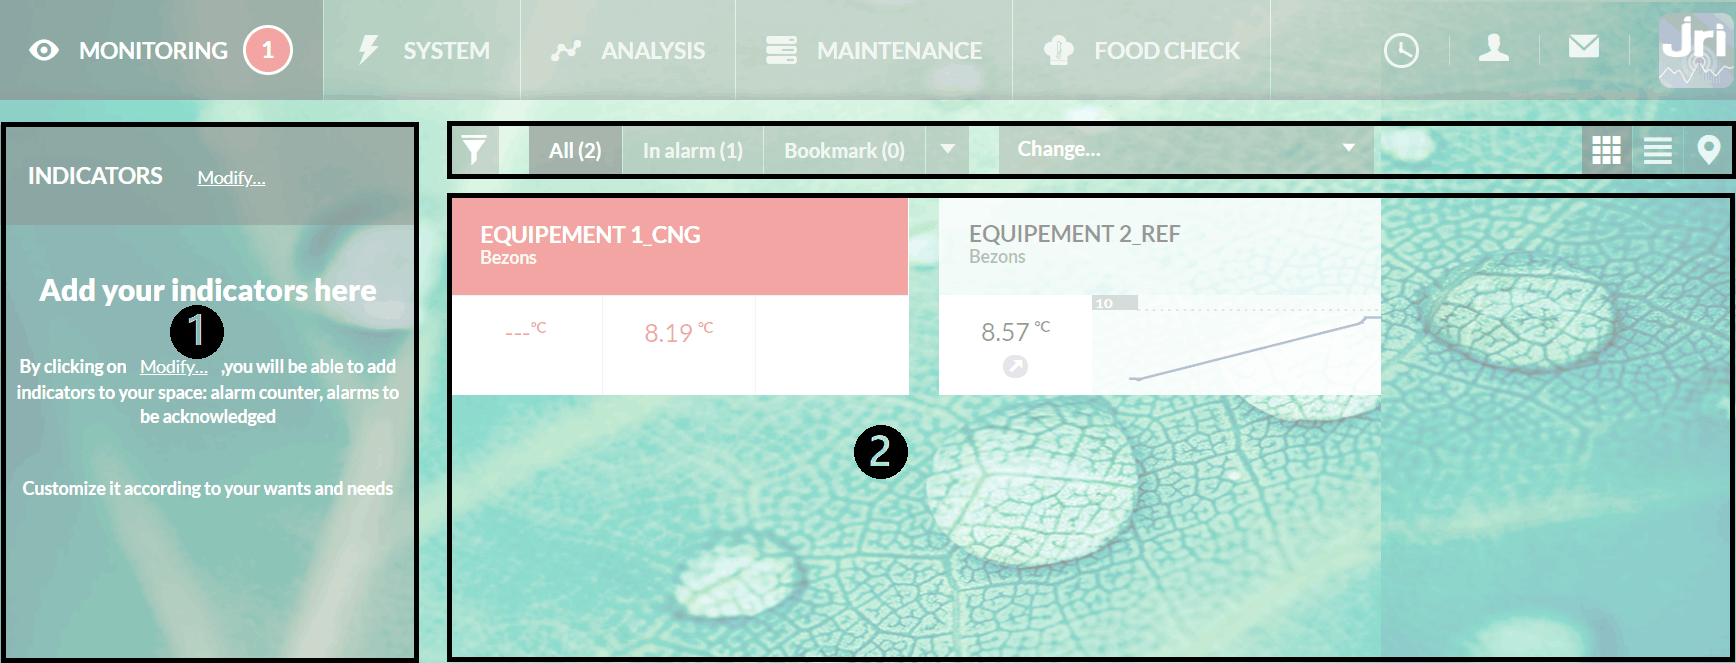
A block on the left with user indicators and on the right the monitored units with their relevant information. The choice of indicators is described in the paragraph Indicator management. These choices are individual for each user.
The section on the right allows the display of the monitored units.
The action line contains:
 A search button to view one or more units not visible on the screen.
 A group of buttons for filtering the visible units: «Park», «In Alarm», «Inhibited», «Favorite», «Taken in charge», «Snoozed». For each case, the number of concerned units is displayed.
 A «Reorganize» button for grouping the monitored units by batch, by model, or by alphabetical order.
 A display mode selector for choosing between «Vignette», «List», or «Layout» modes. If the «Location» module is not activated, the button corresponding to the layout mode is not available.
Under this line the monitored units corresponding to the current zone and grouped by batches are displayed.
Indicators management
The indicators are visible on the « Monitoring » page and on the « System » page. The indicators are the same on these two pages.
Each user can choose the indicators he wants. Depending on his rights, some will not be accessible (ex: Technical alarms when the user does not have access to « System »).
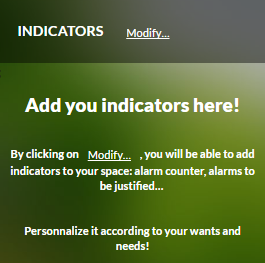
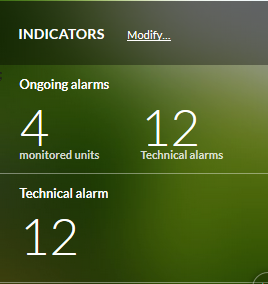
At first, the « Indicators » panel is empty. The user is invited to add indicators.
The « Modify » button opens a window enabling the choosing of the desired indicators. It is also by this window that they can be removed.
The chosen indicators are saved and linked to the user ID. They will be saved and reloaded at each connection.
When the user clicks on an indicator value, he is redirected toward the corresponding data.
List of available indicators:
Current alarms
Double indicator with on one side the monitored units in alarm and on the other the technical alarms.
Clicking on the number of units in alarm redirects the user to the « Exploitation » screen filtered by « In alarm ». Clicking on the number of technical alarms redirects the user to the « System » screen filtered by « In alarm ».
Units in alarm
Displays the number of units in alarm.
Clicking on the number of units in alarm redirects the user to the « Exploitation » screen filtered by « In alarm ».
Technical alarms
Displays the number of current technical alarms
Clicking on the number of technical alarms redirects the user to the « System » screen filtered by « In alarm ».
Inhibited units
Displays the number of inhibited units.
Clicking on the number of inhibited units directs the user to the « Exploitation » screen filtered by « Inhibited »
« Snoozed » units
Displays the number of snoozed units
Clicking on the number of snoozed units, the user is redirected to the « Exploitation » screen filtered by « Snoozed »
Units taken in charge
Displays the number of units taken in charge
Clicking on the number of snoozed units, the user is redirected to the « Exploitation » screen filtered by « Taken in charge »
Technical alarms « taken in charge »
Displays the number of technical alarms currently taken in charge.
Clicking on the number of technical alarms redirects the user to the « System » screen filtered by « In alarm ».
Taken in charge
Double indicator, grouping the number of units and the number of technical alarms taken in charge
Alarms to be justified
Displays the number of alarms to be justified.
Clicking on the number opens a page with the list of alarms « To be justified ».
Power error
Displays the current number of power error alarms
Clicking on the number redirects the user to the « System » screen filtered by « In alarm ».
Sensor error
Displays the current number of « sensor error » incidents
Clicking on the number of sensor errors redirects the user to the « System » screen filtered by « In alarm ».
Communication error
Displays the current number of « communication error » incidents.
«Thumbnail» display mode
 For displaying the monitored units in the form of thumbnails
One can have 2 types of unit thumbnails:
- One for units with a single measurement point
- One for units with multiple measurement points.
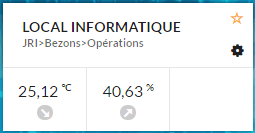
Single-point unit
The display in vignette form provides a summarized and easily interpreted view of the important information regarding the monitored units.
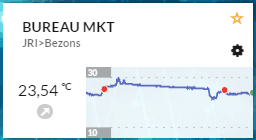
The title bar allows rapid identification of the monitored units.
Just below is displayed the path to its location in the tree of zones defined for the « Domain ». The zone in which the monitored unit is placed is always displayed.
In the lower section, the last measurement received is displayed with its unit and a trend arrow. This “current” value is not necessarily saved and visible on the curve. At mouseover, the time elapsed since its display is shown (ex: « 10 minutes ago »). If the measurement is more than 24h old, it is replaced by « —– »
Next to the last measurement, the graph of the last 24h sliding time period is displayed with only the thresholds and the events of the curve (alarm, acknowledgement, …). For the thresholds, the highest and lowest thresholds are displayed:
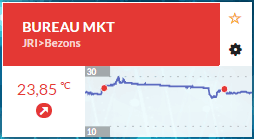
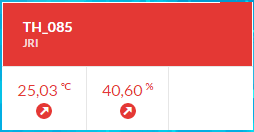
In the event of a threshold alarm, the title background and the value change color:
- If the monitored unit has a noncritical threshold alarm, the title bar is displayed in orange.
- If the monitored unit has a critical threshold alarm, the title bar is displayed in red.
If the monitored unit is inhibited, the title bar and the value are displayed in gray with the inhibition icon
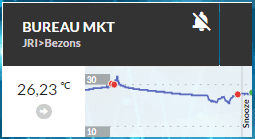
A mouseover of the icon  reveals the inhibition duration (unlimited or not).
By clicking on the value of the last measurement value, the action button(s) on the alarms is (are) displayed:
- If the monitored unit is in alarm, it is possible (depending on the cases) to acknowledge or « snooze » the monitored unit.

- If the monitored unit is not in alarm, only inhibition of the alarms is possible.

The actions on the alarms are described in the paragraph Alarm and alert management.
At mouseover of the vignette, a block of 2 buttons appears at the upper right enabling designation of the monitored unit as favorite (yellow star) or opening the unit configuration on the « Configuration » tab (black wheel).
If the monitored unit is already in the favorites, the yellow star is full and permanently displayed.
Clicking on the name of the monitored unit or on the graph opens the monitored unit data sheet the measurement tab
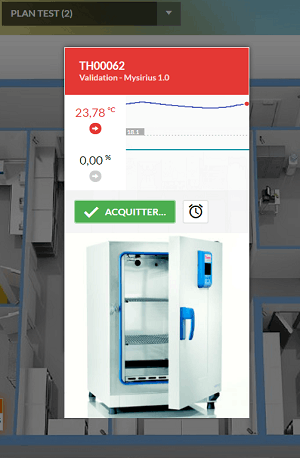
Multi-point unit
As it is the case for the monopoint unit, the name of the monitored unit and the location path of its zones are displayed in the title bar of the vignette.
Each measurement point is displayed below the title bar with the last received value, trend, and the elapsed time of mouseover. This display adapts to the number of measurement points of the monitored unit.
In the event of an alarm, the concerned point(s) change color along with the title bar of the monitored unit vignette. If multiple points are in alarm, the title bar changes to the most serious alarm color: if one point is orange (noncritical alarm) and one point is red (critical alarm), the title bar will be red.
 As is the case for the monopoint unit, mouseover of the monitored unit reveals the buttons for adding the monitored unit to the favorites and accessing the configuration. By default, no curve is displayed relative to the measurement points, but clicking on one of the values will cause the corresponding curve to be displayed.
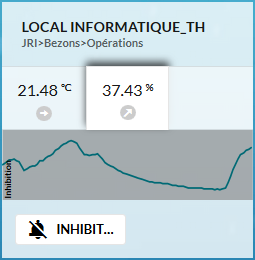
Along with the curve, the alarm treatment buttons (acknowledge, inhibit, or snooze) are displayed according to the monitored unit status.
Clicking on the monitored unit name or on the graph opens the monitored unit sheet to the measurement tab
« Table » mode
 Enables display of the monitored units in table or list format.
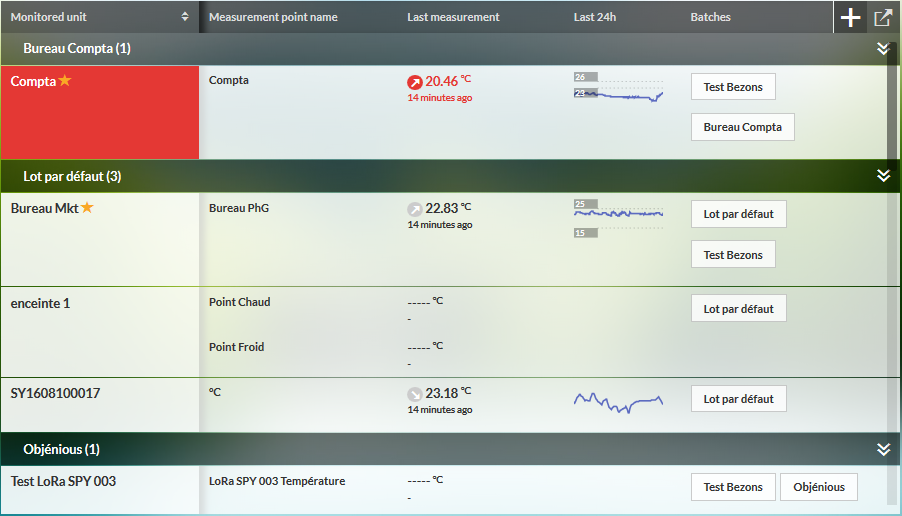
The table shows one line for each unit with its name, the batches (in list) to which it belongs and the favorites star if there is one. Each unit line is divided in to as many lines as there are measurement points. For each measurement point, the trend, the last value, the elapsed time since the last value, and the graph are displayed.
 enables the personnalization of the displayed columns (add or delete columns).It is also possible to customise the order of the columns in the tables. These preferences are saved in the browser.
 enables the exportation of the page contents in CSV format in order to open it in a spreadsheet.
Mouseover of the monitored unit name reveals the alarm action buttons (Acknowledge, Inhibit or Snooze) according to the monitored unit status.
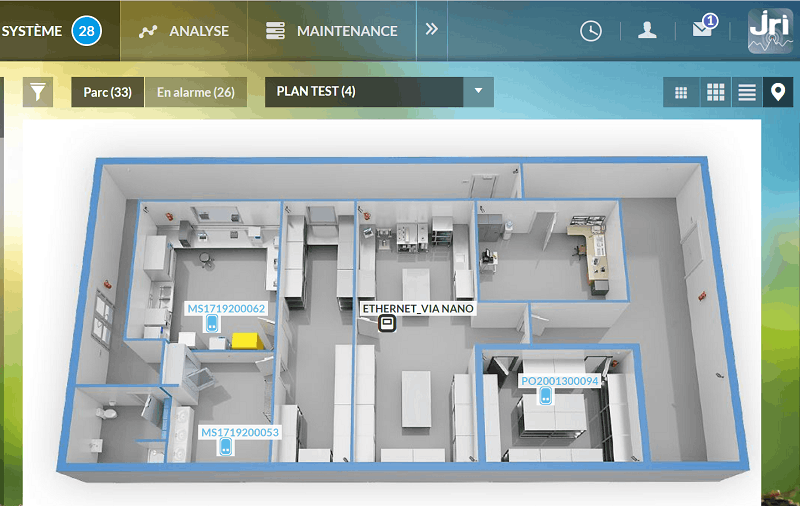
« Map» mode
 Enables switching to maps display mode to locate the monitored units.
This option is available only if you activate the optionnal MAP MODULE. Monitored units are displayed as mini-thumbnails with information on the status alarms and the las readings.
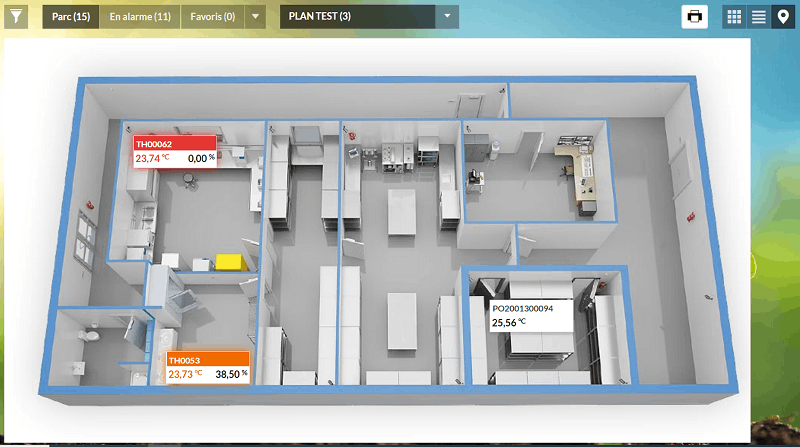
If GPS coordinates have been added when creatinf a MAP, it’s possible to locate it using Google Maps by clicking on the LOCATE button :

A click on a monitored unit displays more details with a picture of the unit.
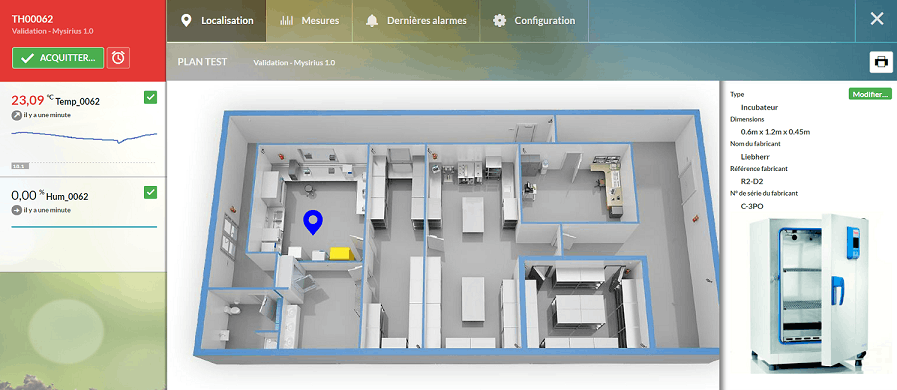
« Monitored Unit » data sheet
The monitored unit data sheet displays all unit information.
In the left column are the monitored unit name and the location path as well as the list of measurement points along with : their name, the last measurement, the date of the last measurement, and the curve for the las 24 hours (sliding). Each point can be selected or not.
A title bar containing 5 tabs: « Location », « Measurements », « Last alarms » , « Configuration » and « Metrology ». The “Location” tab is displayed only if the “Location” module is activated.
Each of the tabs displays the data of the selected measurement points.
The monitored unit data sheet is displayed starting from vignette or list mode:
- Clicking on the monitored unit name:
- Selects all the measurement points
- Opens the « Location » tab if the module is active, otherwise it is the « Measurement » tab in curve mode.
- Clicking on the graph:
- Opens the « Measurement » tab in graph mode.
Location
If the MAP module is active, the monitored unit location on the map can be displayed. See « Maps management » on the Adminsitration guide.
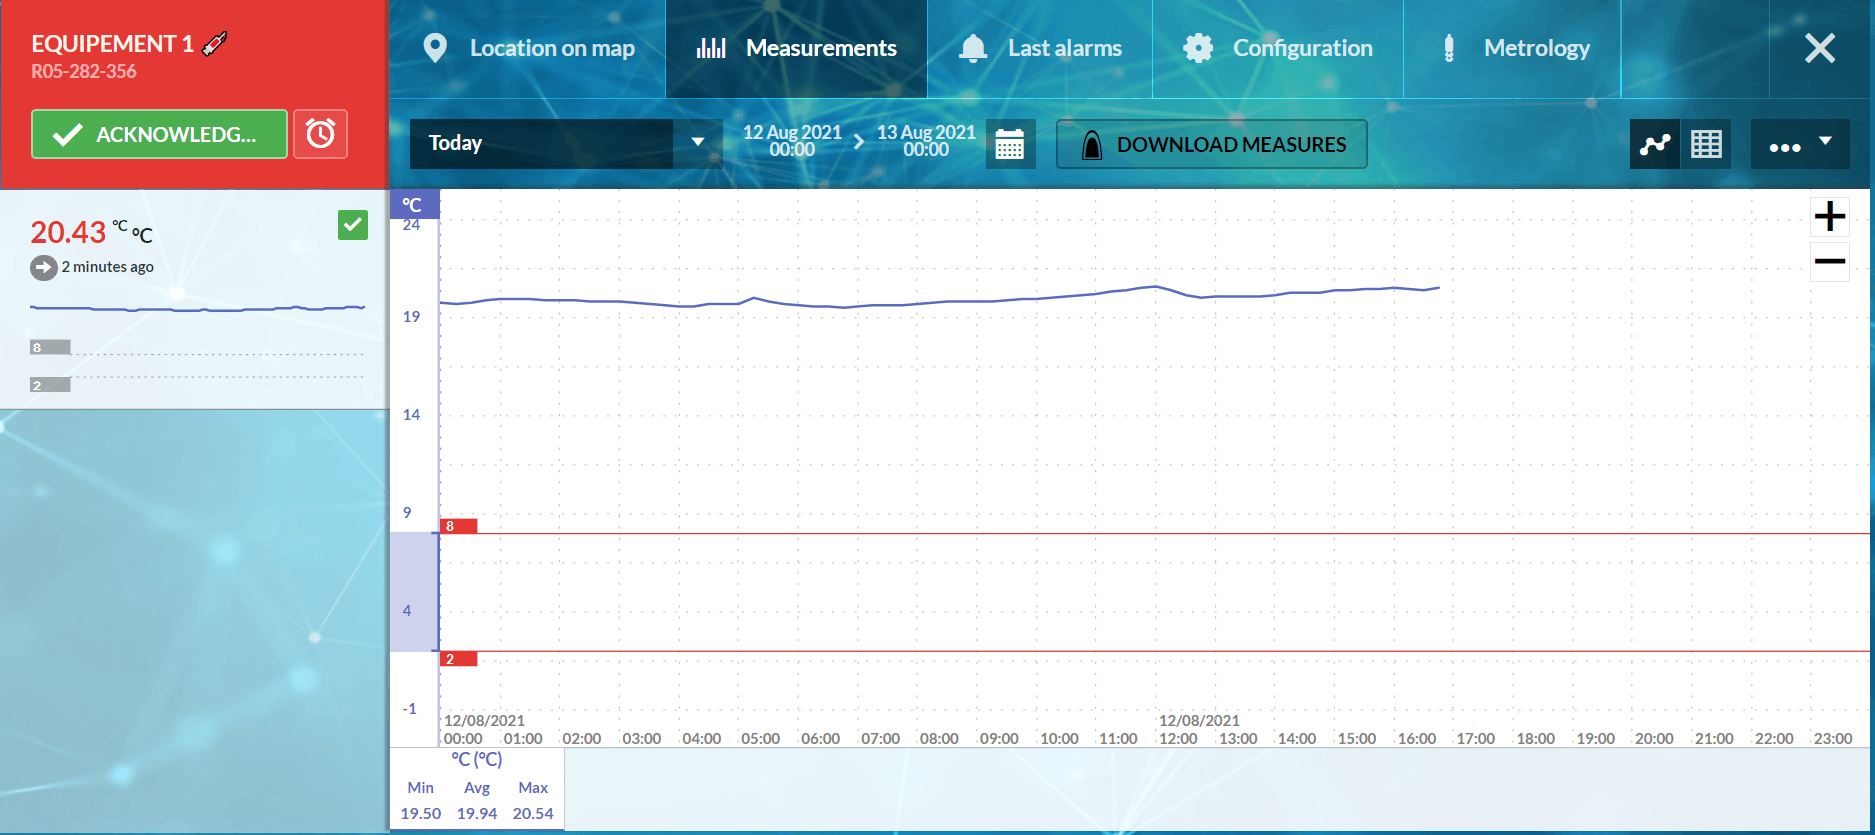
Measurements
This tab displays the measurements in either graph or table format. Only the data of the selected points are displayed.
An action bar enables action on the displayed data.

Choose the displayed period :
- Either by a predefined period
- Today
- Yesterday
- Current week
- Last week
- Current month
As a function of the choice, the dates of beginning and end are displayed on the right
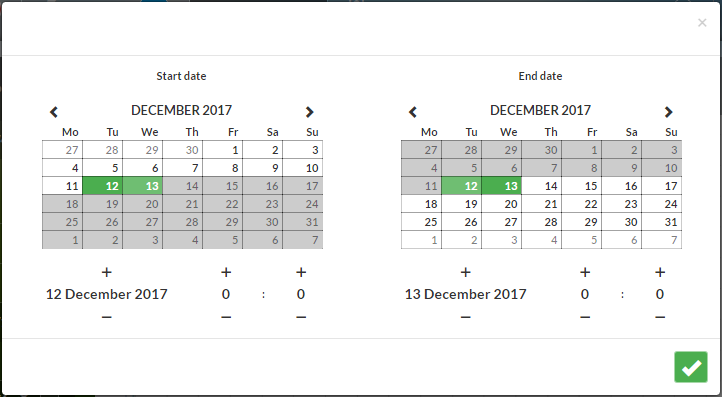
- Or by selecting the dates
A « calendar » appears enabling modification of the selection. This item opens the calendar of choice of dates of beginning and end.
Choose the display mode
- The buttons
 enable the choice of measurement display mode in order to change from graph to table mode and inversely. This mode change does not modify the selected period.
Choose other actions
- The menu button
 enables access to other functions:
- Print the graph: The printout contains the graph, the monitored unit name and the measurement points (with min, max, average) as well as the start and end dates.
- Export the measurements in CSV or PDF
- Export measurements as a secure file (.sbm) readable only by JRI METROLOG software.
- Advanced export of the graph: allows to integrate a comment + information on the monitored unit configuration
- Options: Allows management of the graphic display preferences
- Add a comment: To add a comment on the curve for a measurement point or for the monitored unit
- Open the analysis screen: To open the analysis screen with this unit selected.
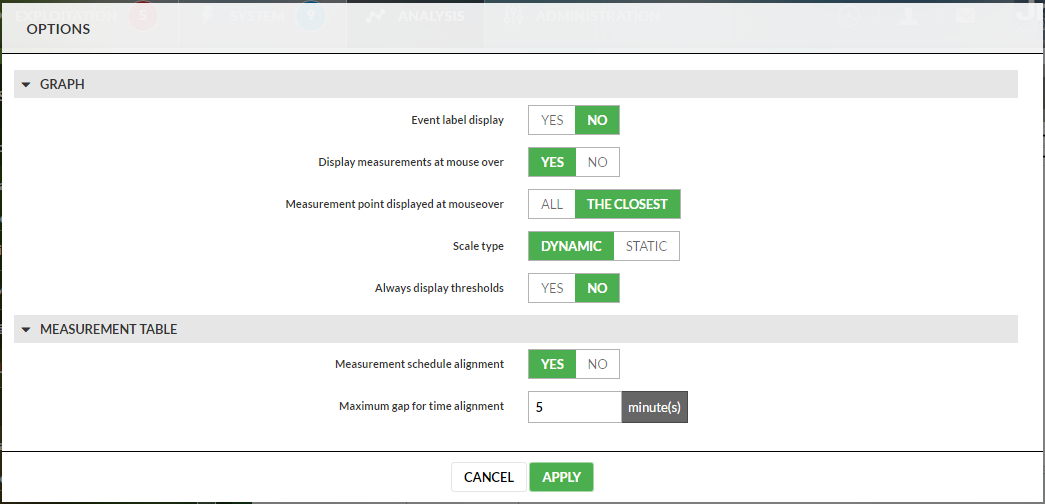
Options
These functionnality allows to the user to personaIize the graphical display and alarms statistics.He can choose:
- For graphic display
- Always display thresholds : significate that in analysis the lines that show threshold are always visible for all grph selected
- Event label display : significate that all the events or commentary are readable. Otherwise you must mouseover the event dot on the graph to display it.
- Display of measurements at mouseover of the curve :This option specifies which measurement points are displayed at mouseover (all or the closest)
- The type of scale (dynamic or static) : In dynamic, the scale is adjusted regardin min and max values of the displayed area
- For measurement table display
- Activation time alignment : this option allow you to align data that are a little bit not synchronized. You are invite to enter the gap for alignment
- For alarm statistics
- Exceeded Time : Sum of all overruns (above or below except allowed overrun duration) over the period displayed in graphic mode
- Time in alarm : Period on which the unit is in alarme since triggering of the threshold (at the end of the allowed overrun duration) until come back on the good side of the threshold. If the period displayed in graphic mode shows more than one alarm, the time in alarm will be the sum of all periods in alarms.
- Mean acknowledgment time : Time taken by the user to acknowledge the alarm of a unit. This time is from the moment the alarm is triggered (at the end of the allowed overrun duration) until the acknowledgment by the user over the period displayed in graphic mode. If on this periode there is more than one acknowledgment, it will be the mean time of all acknowledgments. These three criteria can be calculated:
- by differentiating or not high and low thresholds
- by differentiating critical and non-critical thresholds
Display preferences are saved in the browser. If the user changes PC or browser these preferences are lost.
Last alarms
Clicking on “Last alarms” results in the display in a table by My Sirius of all the last alarms which have occurred. For each measurement point, MySirius displays the type of alarm, the alarm date, the state (acknowledged, snooze, …), the acknowledgement information (if the alarm has been acknowledged).
For the obsolete alarms « to be justified », a button « Justify… » allows opening of the “Alarm justification” window and justification of the alarm by:
- entering a “cause” to be selected from a pre-established list of causes or by manually entering a cause if there are none which correspond. This list is identical to the one proposed for the acknowledgement of an alarm.
- the characterization of the impact that this alarm could have had on the products.
Remark: Only the threshold alarms are present on this screen. The history on this screen is 15 days. To see the previous alarms, you must refer to the activity log.
Configuration
This tab displays the configuration of the monitored unit and of the measurement points. If the user has modification rights, a « Modify… » button will link to the « Administration » section to enable the necessary modifications.
“OBSERVER” Mode

This mode allows to display monitored units measurements and alerts on a web page with an automatic refresh every 2 or 10 minutes depending on the size of the fleet. The display is active as long as the page is open and the user’s Windows session is active. In case of an alert on an equipement, the monitored units changes its colour and a sound is played by the browser.
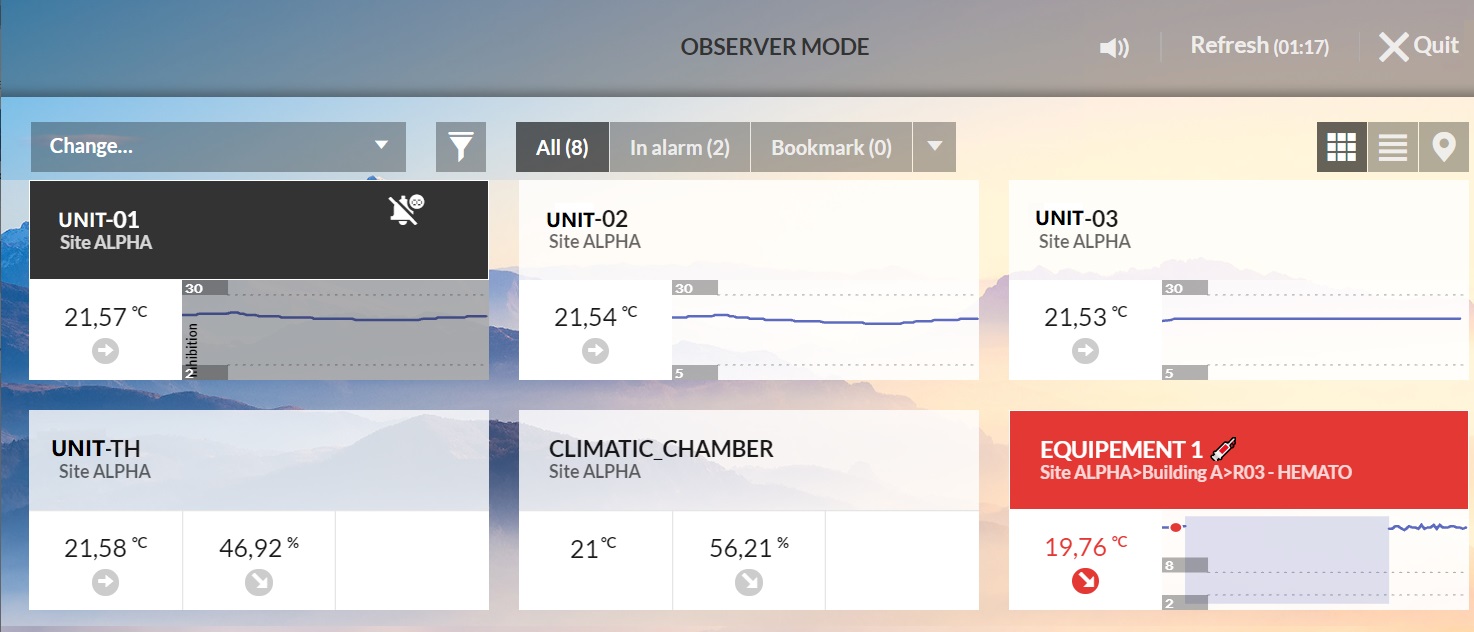
The control bar allows to mute the sound, force the page to refresh or exit the OBSERVER mode.

Alarm management
When alarms are triggered, they are shown in several ways :
- In the menu bar,
- The number with red background on the “Exploitation” module tab indicates the number of units in alarm threshold alarms
- The number with blue background on the “System” module tab indicates the number of devices in alarm technical alarms
- From version 3.2 onwards, a notification is displayed in the browser when a new alarm is triggered. Content of the notification: “New alarm detected! The data displayed may not be up to date. Refresh”
In the body of the display window, the monitored units in alarm appear in red when the “Exploitation” module is selected and the devices in blue when the “System” module is selected
The possible actions on the alarms are:
- Acknowledge, take in charge and snooze for the threshold alarms
- Validate or take in charge for the technical alarms
Acknowledge / Take in charge a threshold alarm
To perform this action following the reception of a message or by observation on the application, one has to select the measurement point which is in error state in the monitored unit vignette “Exploitation” tab); the vignette expands and reveals the button:
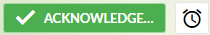
Click on Acknowledge:
- A window opens allowing either acknowledgement or taking in charge of the alarm
- To acknowledge, the operator must:
- enter the cause of the triggering of the alarm from a pre-established list of causes. If none correspond, he can manually enter one. This action stops all reports and reinitializes the alert process.
- He can enter a corrective action. This option can be required according to the configuration performed in the general preferences.
- He can also enter a notion of criticality according to the impact that this overrun may have had on the monitored products.
- The taking charge allows time to correct the problem encountered. In this case the operator chooses to take charge then enters the time necessary to perform the correction. This action :
- Suspends all the other planned alarm reports
- Displays the taking charge
 icon in the title bar of the device vignette while maintaining it visually in error state (red background). A mouseover of this icon displays the name of the operator having performed this taking charge as well as the response time interval defined.
 - Reminds the operator having performed the taking charge at the end of the defined time interval
- Restarts the alert cascade of the monitored unit in alarm after a 10 minutes period
- Allows the operator to take again charge if he doesn’t have the time to react.
- To acknowledge, the operator must:
Snoozing an alarm
Snoozing an alarm extends the overrun duration authorized before reacting. When the operator clicks on “Snooze”  he will be invited to enter a time interval at the end of which he will be again notified if the problem is still present.
- If the monitored unit is still in alarm at the end of the snooze, the alert is triggered again. It will not be possible to perform another one. Only acknowledgement or taking in charge will be possible.
- If the monitored unit is no longer in alarm at the end of the snooze, the alarm is no longer to be acknowledged but rather to be justified.
Justifying an alarm
The alarms are triggered as they arise. It is possible that an alarm initially triggered is replaced by a new alarm or a re-triggering following a snooze. In this case, the 1st alarm takes the status of an alarm to be justified whereas the new alarm is to be acknowledged
- The justification of the alarm is performed in the same way as for the acknowledgement of the alarms.
- The alarms to be justified are accessible via the indicator of alarm to be justified or via the unit data sheet
Validate or Take in charge for technical alarms
To perform this action following reception of a message or by observation on the application, one has to select the vignette of the device in error state (“system” tab). It expands and reveals the button:

- A click on “Validate” validates the action, cancels all the alarm reports and reactivates the process of detection of technical alarms. There is no cause to enter.
- Taking in charge
 allows time to correct the problem which has arisen. In this case the operator chooses the taking in charge then enters the time needed to perform the correction. This action:
 - Suspends all the other planned alarm reports
- Displays the taking in charge icon in the title bar of the device vignette while maintaining it visually in error state (blue background). A mouseover of this icon displays the name of the operator having performed this taking in charge as well as the response time interval defined.
- Reminds the operator having performed the taking in charge at the end of the defined time interval
- Takes up again the reports at the point where they were interrupted
- Allows the operator to take again in charge if he hasn’t had the time to intervene.
« System » menu
The body of the window is divided in 2 : the indicators on the left and the equipment data sheets on the right. The indicator section on the left is the same as for the « Exploitation » menu.
In the same way as for the exploitation, an action bar composed of different button groups is displayed in the section on the right:
 ) Button group enabling the filtering of the visible devices : « All », « In Alarm ».
 Button group for choosing between the modes « Mini Vignette », « Vignette », « Table » and « Layout » (if the “Location” module is active).
 Button group for reorganization enabling grouping by device type (Nova SPY D, Nano SPY T, Nano SPY TH, SPY RF N1, …), by function (recorder, gateway, …), by family (SPY RF, Nova, Nano, LoRa) or by function and family
In table display, the devices are automatically grouped by family and function
« Thumbnail » mode
The vignettes are identical to those of the « Exploitation » menu but the displayed data are not the same as a function of the device type.
In the heading, MySirius identifies the device type with the help of a pictogram of its serial number as well as its location path.
In the lower part of the vignette, the left frame displays the number of technical alarms. If there is at least one alarm, the heading background turns blue
The « Information » section depends on the device type:
- Recorders:
MySirius displays the serial number of the recorder, its location and the IDs of the communication devices to which it is connected and the monitored unit in which it is placed.
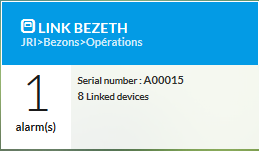
- Communication devices (Nano SPY LINK)
MySirius displays the name given to the Nano SPY LINK as well as the number of (recorders, relays, alert modules) which communicate via this modem.
- Alarm module and/or relay:
MySirius displays the serial number of the Nano SPY ALARM and the number of recorders which communicate via this relay.
Clicking on the vignette expands it to reveal the date of the last message (last communication), information specific to the device and its alarms.
For the Nova SPY & Nano SPY, MySirius displays:
- The model with probe type and length
- The software version
- The battery level
- The radio level (RSSI)
For the Nano SPY LINK et ALARM, are displayed:
- The model
- Software version
- The list of devices which communicate via the device
For the LoRa® SPY, MySirius displays :
- The model with probe type and length
- Software version
- The battery level
- The radio level (RSSI and SF)
For the LoRa® Gateways, MySirius displays : - The model (type (battery or not), communication frequency (915 - 868) and connection type (Ethernet or 4G)) - Software version - The list of devices which communicate via the device
« Mini-thmbnail » mode
To permit the display of more devices at the same time, there is a « mini-vignette » mode. In this mode, only the header bar of the classical vignette is displayed along with the number of alarms. Clicking on the mini-vignette enlarges and expands it for visualizing all information.
« List » mode
The different devices are grouped by family (Nova SPY, SPY RF, Nano SPY, LoRa® SPY) and function (recorder, modem, …) and displayed in table form
The table shows the same information as in vignette mode.
« Map » mode
If the « Location » module is not activated, this button will not be visible
If the module is active, the button is visible and enables the display of the devices (Sensors and Gateways) position . See « Map management » in the adminsitartion guide.
« Analysis » menu
Standard operation
This menu item enables access to the screen for analysis of the measurement point data.
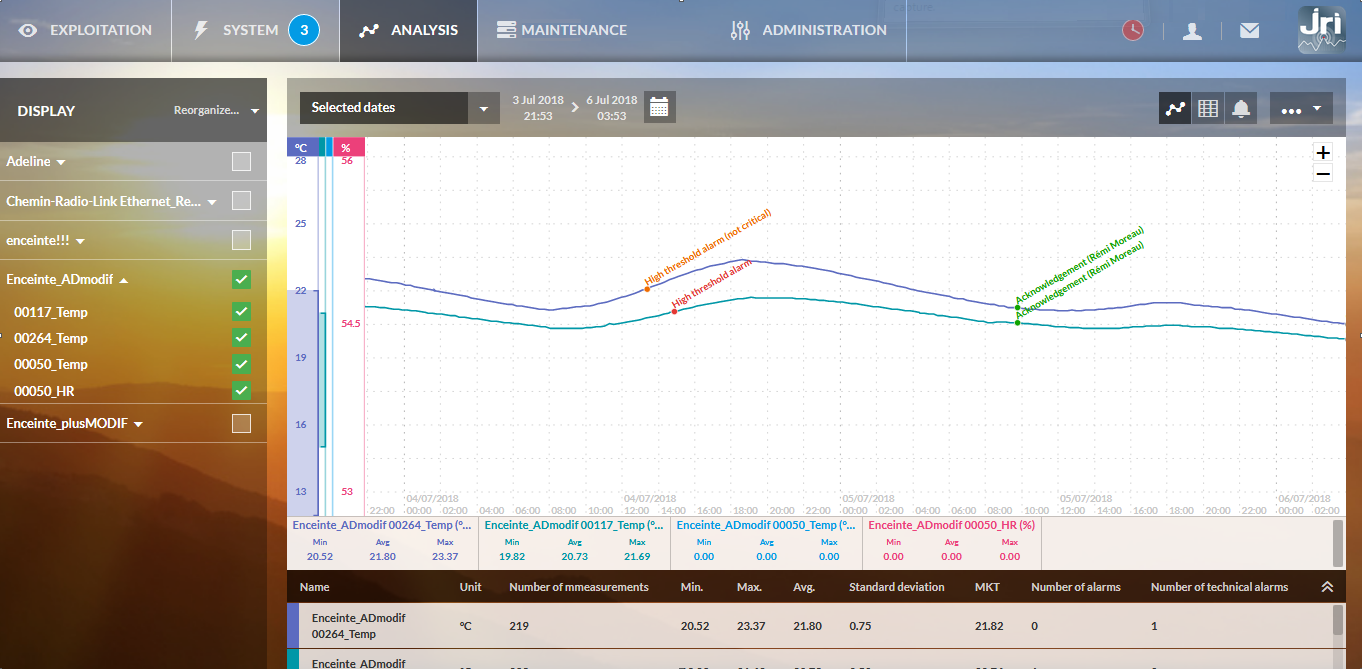
The monitored units are displayed in the left column. Using the « reorganize » button it is possible to display them by batch, by zone, by model or by alphabetical order. The user only sees the monitored units that he has the right to see (those of his batches).
Each monitored unit can be expanded to display its measurement points.
To analyze the data, one must check either the measurement points or directly the monitored units; in this case all the measurement points of the selected units will be checked by default.
The measurement points selected are displayed in the righthand section of the screen.
- The thresholds of the selected measurement points are materialized by a mark of the same color as the curve, on the axis of the ordinates (temperatures).
- The measurement points are identified under the time axis below the curves. A mouseover of a measurement point displays its curve highlighted with the thresholds materialized.
- A table of statistics is also displayed below the graph or the table of values. For each measurement point one finds
- its identification
- the number measurements displayed (period visible on the screen)
- the measurement unit (°C, %, …)
- the mean
- the MKT (if °C or °F)
- the minimum
- the maximum
- the standard deviation
- the number of threshold alarms
- When moving the mouse pointer in the curve display zone, the time-stamped value of the closest measurement point or of all the curves aligned on the pointer are displayed. The display depends on the choice made in the graphic display options
- It is possible to enter a comment by positioning the mouse on a point of one of the displayed curves.
The righthand section also contains an action bar above the table of values or of the curve enabling action on the displayed data.

It is possible to choose the displayed period:
- Either by a predefined period
- Today
- Yesterday
- Current week
- Last week
- Current month
Depending on the selection, the start and end dates are displayed on the right.
- Or by selected dates
- The « calendar » icon enables selection of the dates to modify the selection.
Choose the display mode
- The buttons
 enable the choice of the mode of display of the measurements, to change from graph mode to table mode and inversely. This mode change does not modify the selected period.
 - By clicking on the
 , the alarm statistics appear according to what has been configured in the ** “Options” ** menu of the other actions menu.
Choosing other actions
- The menu button allows access to different functions:
- Print the graph : The printout contains the graph, the monitored unit name and the measurement points (with min, max, mean) as well as the start and end dates.
- Export the measurements in CSV
- Create or load an archive.
- Options : For managing the graphic display preferences
- Add a comment: To add a comment on the curve for a measurement point or for the monitored unit
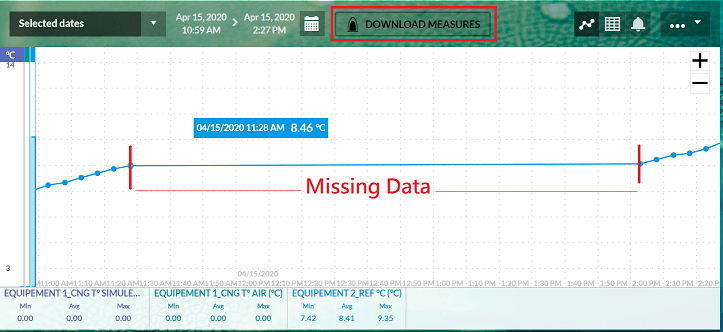
Manual Data Download
If data is missing on a graph after automated data recovery attempts (possible cause: communication failure), a manual data download (from the recorder MySirius) can be done by clicking on the DOWNLOAD MEASURES button.
Options
These functionnality allows to the user to personaIize the graphical display and alarms statistics.He can choose:
- For graphic display
- Always display thresholds : significate that in analysis the lines that show threshold are always visible for all grph selected
- Event label display : significate that all the events or commentary are readable. Otherwise you must mouseover the event dot on the graph to display it.
- Display of measurements at mouseover of the curve :This option specifies which measurement points are displayed at mouseover (all or the closest)
- The type of scale (dynamic or static) : In dynamic, the scale is adjusted regardin min and max values of the displayed area
- For measurement table display
- Activation time alignment : this option allow you to align data that are a little bit not synchronized. You are invite to enter the gap for alignment
- For alarm statistics
- Exceeded Time : Sum of all overruns (above or below except allowed overrun duration) over the period displayed in graphic mode
- Time in alarm : Period on which the unit is in alarme since triggering of the threshold (at the end of the allowed overrun duration) until come back on the good side of the threshold. If the period displayed in graphic mode shows more than one alarm, the time in alarm will be the sum of all periods in alarms.
- Mean acknowledgment time : Time taken by the user to acknowledge the alarm of a unit. This time is from the moment the alarm is triggered (at the end of the allowed overrun duration) until the acknowledgment by the user over the period displayed in graphic mode. If on this periode there is more than one acknowledgment, it will be the mean time of all acknowledgments. These three criteria can be calculated:
- by differentiating or not high and low thresholds
- by differentiating critical and non-critical thresholds Display preferences are saved in the browser. If the user changes PC or browser these preferences are lost.
Archive management
Archive creation
In the menu of the « Analysis » window , the « Create an archive » request allows the user to save the « raw » measurements of the period displayed on the screen in an encrypted file useable only with My Sirius (\*.msarch)
Before creating the archive, one should adjust the displayed period and choose the monitored units concerned before archiving the data.
An archive enables the visualization and analysis of the data from one or multiple units which may have been deleted, or which represent a specific period.
Loading an archive
In the same menu, the « load an archive » request enables the display of the measurements contained in the file and their manipulation using the tools available in MySirius.
To load an archive, simply drag and drop a file \*.msarch into the window
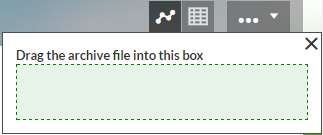
If the file or the data are not correct, the user is notified.
When the archive is loaded:
- A message bar appears indicating that an archive is being consulted.

- It is not possible to see the measurements beyond the displayed dates (archive created from value table mode)
- If the archive was created from the graph, it contains more measurements than the recorded period. The user can consequently shift by one period to the left and one to the right.
- The list of units in the left-hand section is replaced by the list of the monitored units present in the archive.
- It is not possible to save a new archive.
- The measurements outside the archive will not be displayed, even if they still exist in the database.
When the user closes his archive (button « Close archive » in the red bar), one returns to the preceding display (before loading the archive).
Audit trail
The audit trail is used to view all the operations performed by users or by the system as well as everythings related to the alarms.
Traced actions are defined by :
- The date of the action
- The type (category) of the action
- The user who performed the action or MySirius when it comes to a system action
For some actions, you can also find the details by clicking on “+”.
The MySirius audit trail is :
- Secure and non modifiable by MySirius users regardless their profile
- Generated by MySirius and only by MySirius
- Complete: All actions performed by the users or by the system (MySirius) are traced.
- Saved throughout the duration of the system.
Access
To Access the audit trail, click on the “My Profile” button in the MySirius main menu bar still displayed on the screen (see “user account management”) an on Audit Trail. All MySyrius default profiles will have this access (Administrator, Batch manager, Simple user…). However, with an “Advanced” license it will be possible to create a specific profile to prevent audit trail access to any type of user.
The information displayed will depend on the type of license subscribed.
- Initial : No access to the audit trail
- Serenity : Only alarm log (threshold alarms, technical alarms, acknowledgment, taking charge, validation)
- Advanced : Complete audit trail
Once the audit trail window is open, the user has several commands at his disposal allowing him to optimize the display of the information sought for:
In the left column, the user can use filters:
- ** Start and end date **: To filter on a given period.
- ** Units **: to display only the lines of a monitored unit (multiple selection)
- Type : to display only certain types of action (multiple selection)
- ** User **: to display only the actions of a user (simple selection)
In the action bar of the audit trail, it is possible to group together the lines of the same unit, the same alarm or the same user to view them in the same block…
There are 2 levels of grouping possible. The choice lists are directly proposed by MySirius
Export
Once all the filters activated, it is possible to export the contents of the audit trail displayed on the screen :
- in PDF format
- in CSV format
User account management
From the menu, the user has access to his profile
This screen is separated into two tabs:
- One for personal data,
- One for alert management.
Personal data
The user can see his login ID, his name, his profile, the batches that he has the right to see and the alert groups in which he is placed.
He can modify his first and last names, change his password and choose his graphic theme (screen background color).
Customize your time zone for data display. This choice is also available in the report options.
Subscription
The user can choose whether or not to receive JRI communications on the following subjects: * Distribution of technical information * Intervention * Software updates * Remaining sms/call
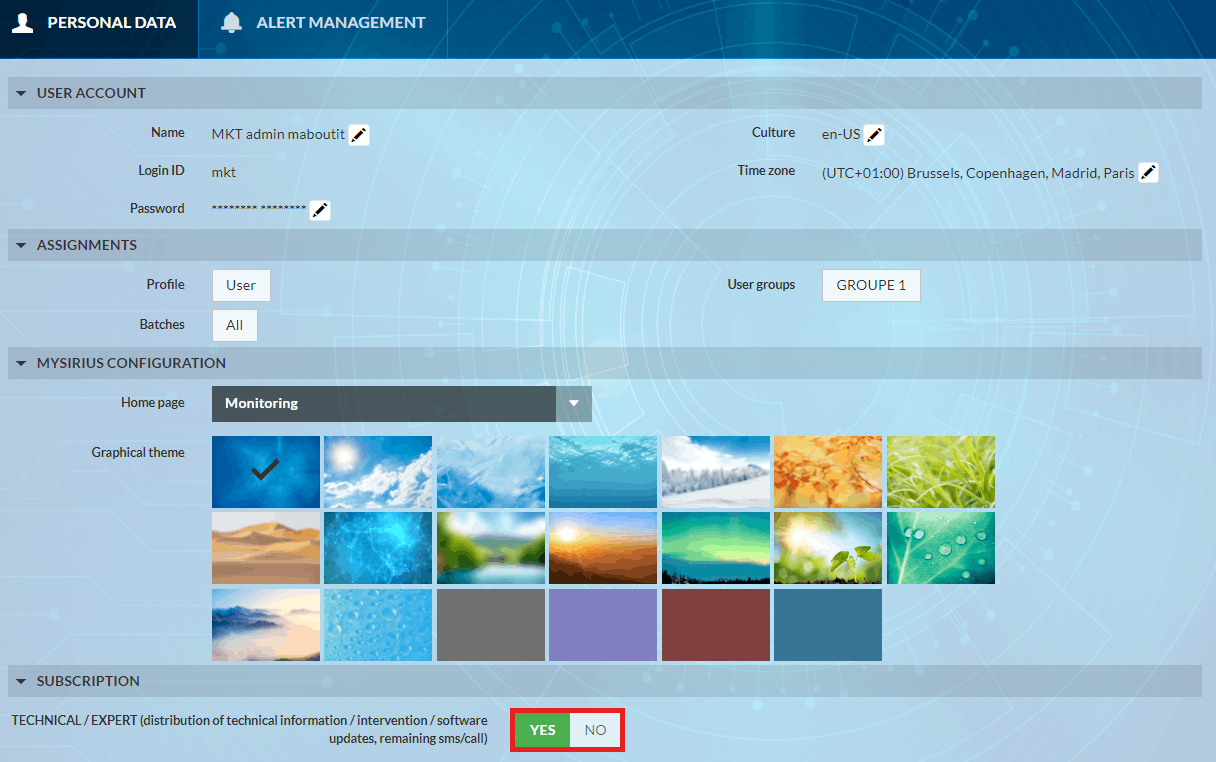
Please note that the Subscription feature is only available to users with a MySirius CLOUD subscription.
Alert management
The user can:
- Manage all his alert means (telephone number, sms or email)
- Choose whether to receive the curve in the alert emails
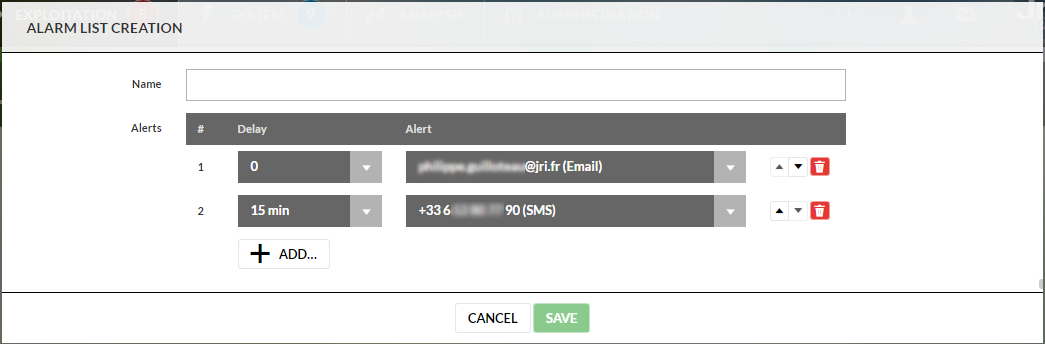
- Manage his alert lists.
A list groups together the alert means that MySirius will use to notify the user. These alert means will be implemented one after the other. He can specify a waiting interval between each alert.
The user can create as many alert lists as he wishes as a function of his schedule.
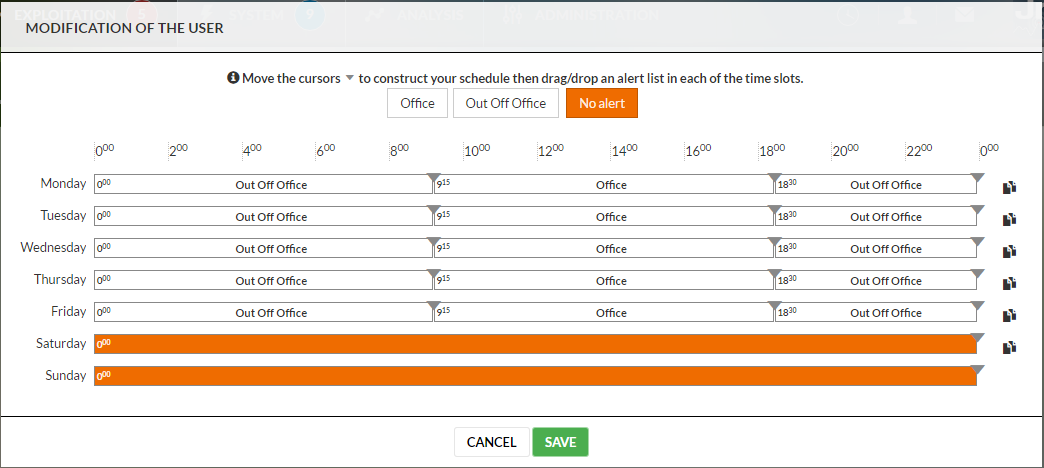
- Managing the alert schedule
The user can divide his weekly schedule into periods and can choose the alert list that he wishes to use for each one.
- Managing exceptional periods.
An exceptional period is composed of a name, a start date, and end date and an alert list to be used during the period.
In the event of alarm, MySirius uses by default the weekly schedule but if an exceptional period is found for the alarm date, it is the list for this period which will be used in place of that of the weekly schedule. The user can thus choose not to be notified during these exceptional days (ex : holidays, vacation…)
User preferences
Two types of preferences are available in MySirius
- General display preferences
During consultation in the « Exploitation » and « Maintenance », menus, the choices made by the user (display mode, filter, « Indicator » column width) will be saved automatically in the current navigator.
The specific filter (entered name of unit or device) is not saved. This is a temporary filter.
If the user closes his navigator and reconnects later, his previous choices will be pre-loaded.
On the other hand, if he consults using another navigator or using another PC, his last choices will not be carried over.
- Graphic display options
The options « Options » requeste accessible from the le menu of the « Unit Information Sheet » and of the « Analysis » tab enable the definition of the preferences for the display of the curves and of the measurement table.
Once defined, they will be applied to all measurement curves and tables even after disconnection followed by reconnection
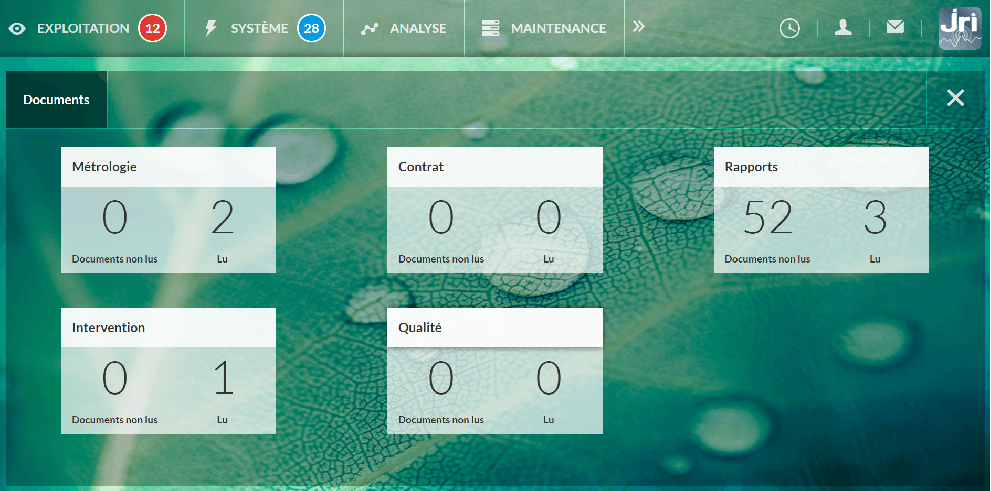
Documents
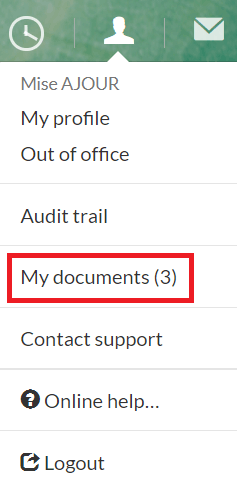
Access to all users documents is done from the Profil button by clicking on MY DOCUMENTS
Documents are organized in 5 main categories : METROLOGY - CONTRACTS - REPORTS - INTERVENTION - QUALITY. A click on each section displays the list of the documents.
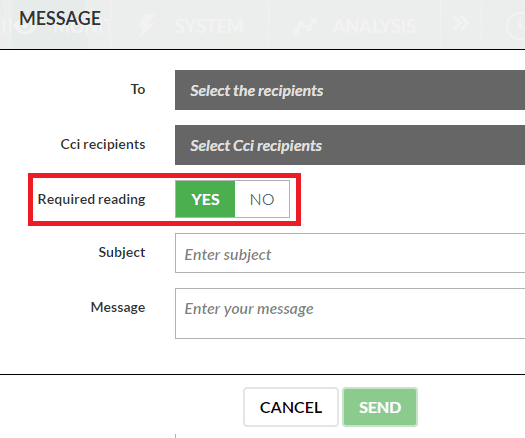
Messages
Messages can be exchanged between MySirius users of the same customer. A message waiting indicator can be shown. This service can also be used by JRI to push information to MySirius users.

When sending a new message, a érequired reading" option can be selected.
JRI Support Contact and Ticket Management
Starting from version 3.2, MySirius allows users to enter technical support requests directly from their profile. It is thus possible to follow the request processing progress in real time and to give feedback after a ticket has been closed.
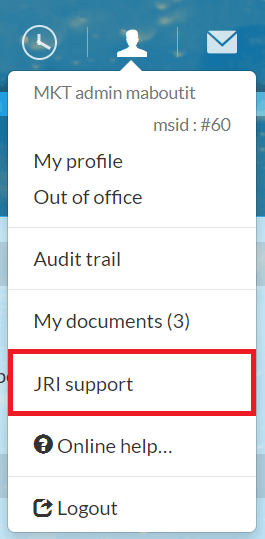
- Home screen followed by “MY TICKETS
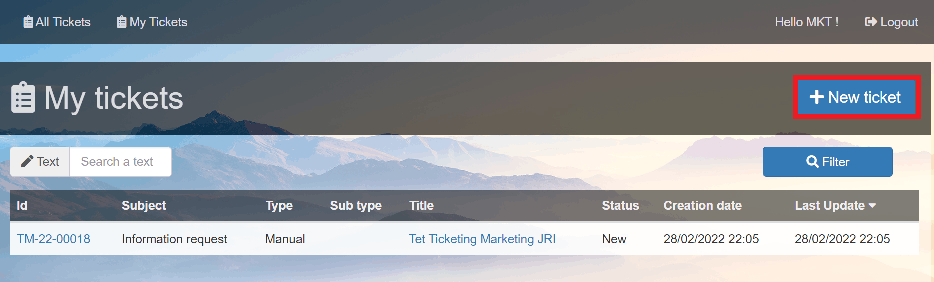
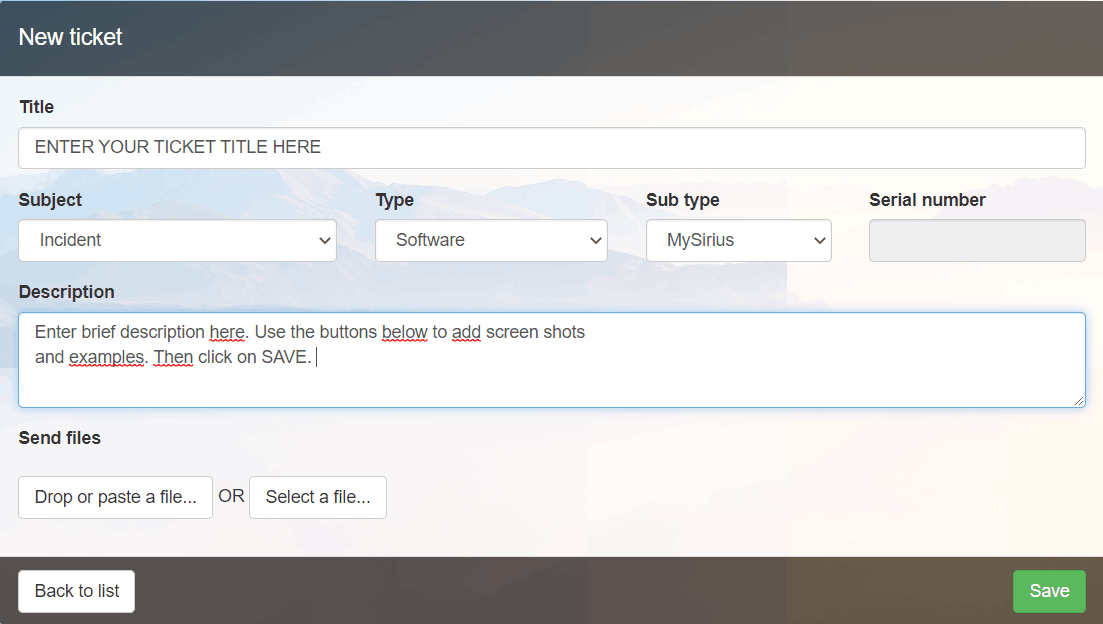
- Enter a technical support request by clicking on + NEW TICKET:
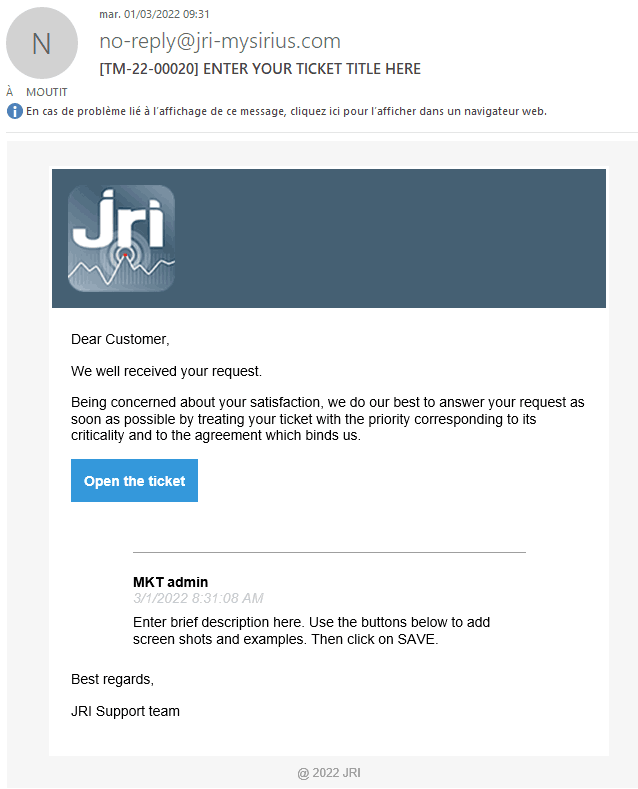
- Receiving a confirmation email:
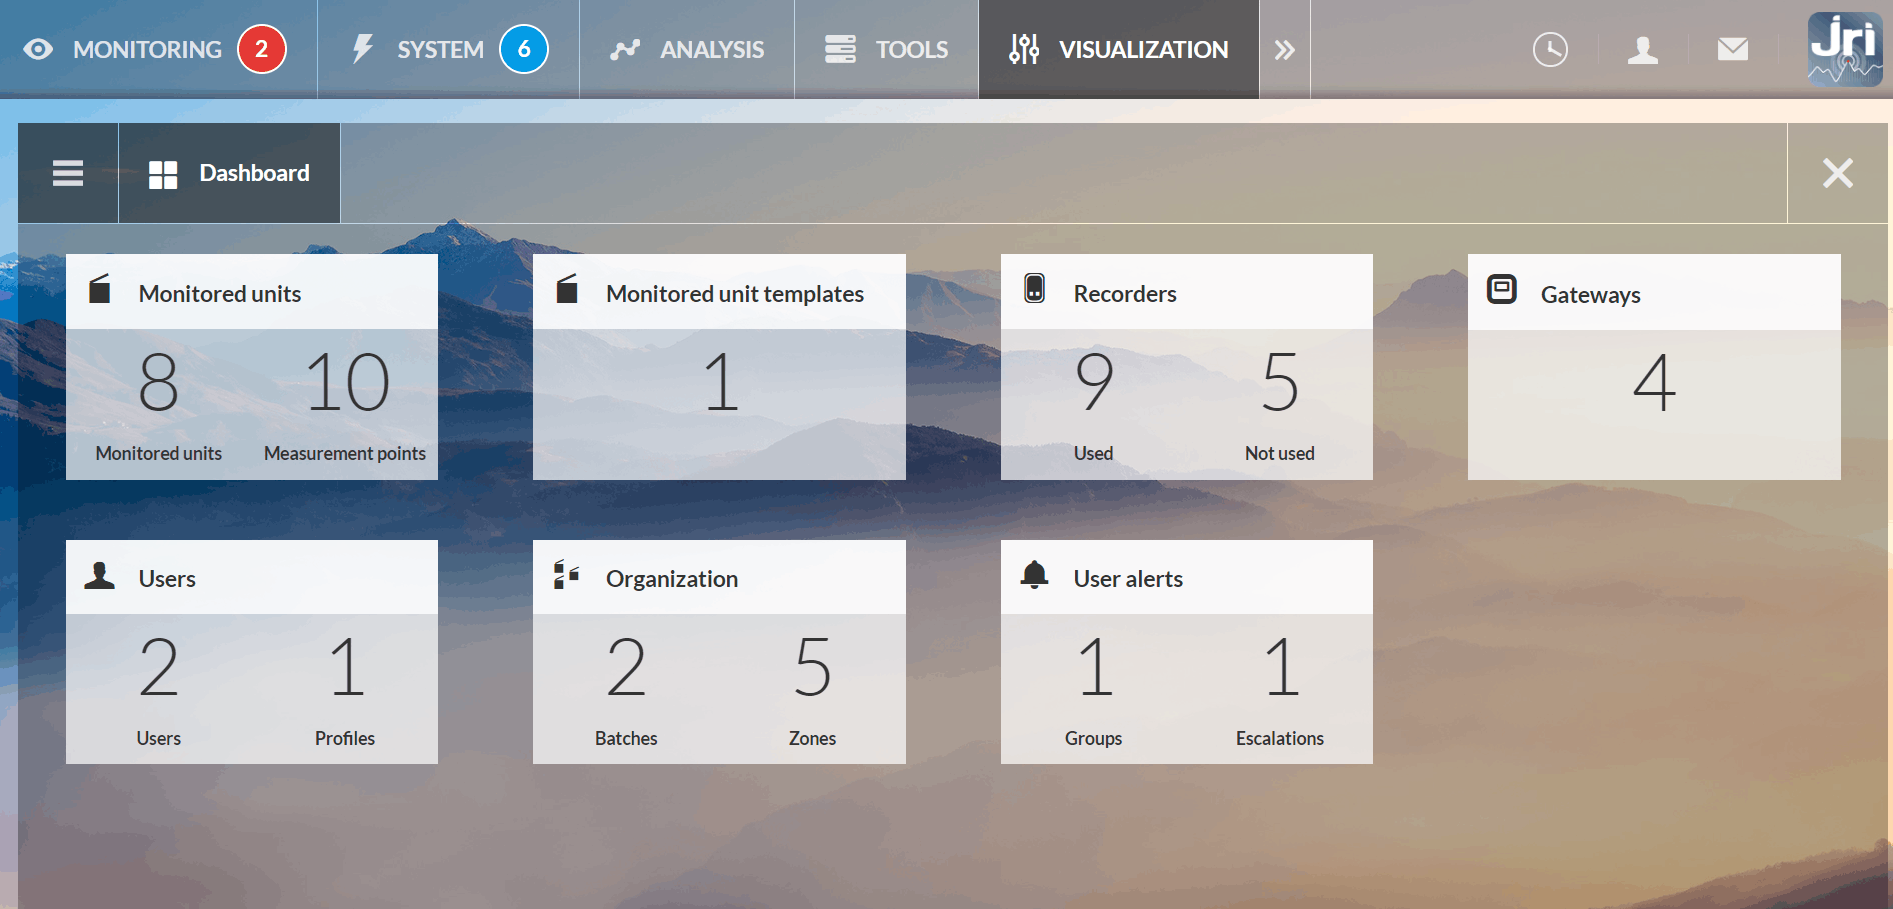
VISUALIZATION TAB
For user profiles with personalised rights (ADVANCED level), it is possible to view the site configuration without making any changes. The ADMINISTRATION tab then becomes VISUALIZATION.
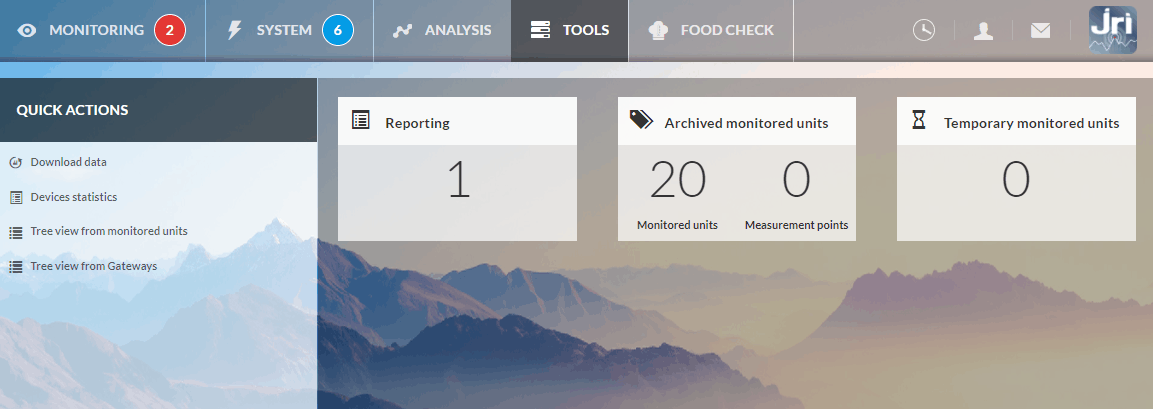
TOOLS tab & MAINTENANCE module
THE MAINTENANCE/TOOLS TAB is available for all MySirius service levels. It allows the edition and visulization of reports, data from archived monitored units or measurement points. It is also possible to create temporary monitored units to view and export data as part of metrological operations (mapping, calibration, verification)
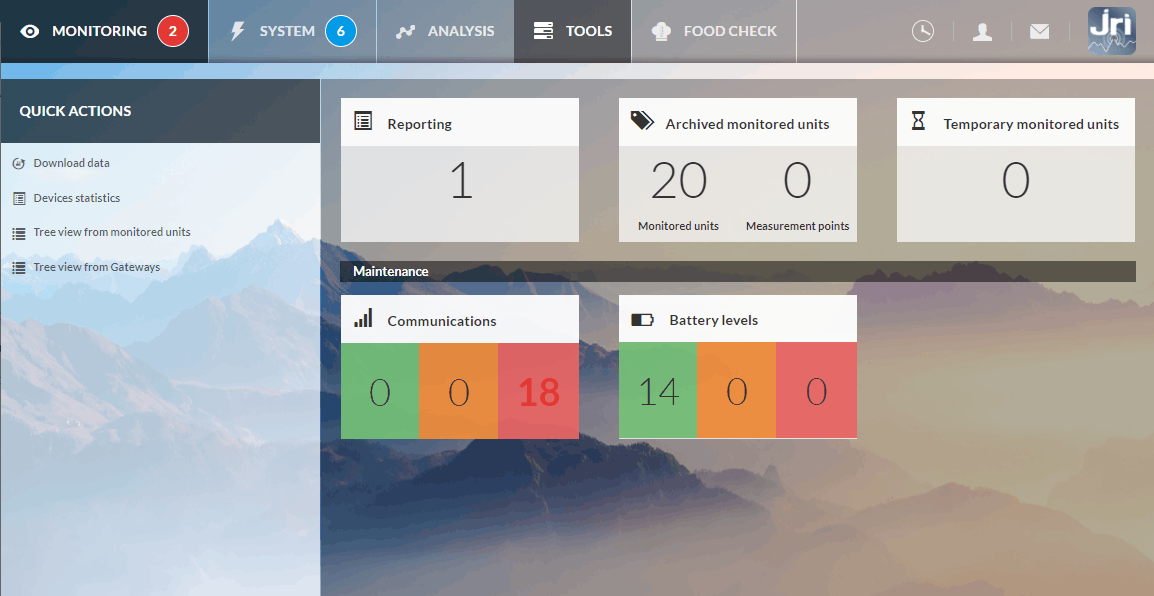
the MAINTENANCE MODULE is optional, available for all MySirius service levels. It provides more detailed elements to easily manage your fleet communication statistics, battery levels and device firmwares (Nova & Nano range)
Reporting
The “Reporting” function allows the user to create automatic reports to have at a given moment an overview of the status of the curent monitoring. So it is possible to create:
- Weekly or monthly reports Rapports hebdomadaires ou mensuels.
- Statistics, alarms, measurements, praphical…reports
Each user whatever its profil can manage (creation or suppression) his own reports.
Report management
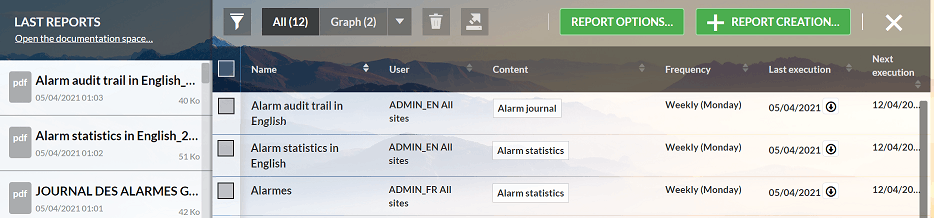
Click on “Maintenance” in the MySirius general menu bar then on “Reporting” indicator. The list of configured reports is displayed as a table with:
- The name of the report
- The name of the user that create the report
- The type of the report (graphical, statistics, history…)
- The edition frequency
- The last edition date
- The link of the last edited report
- The next edition date
A user will see all the programmed reports even they concerned units or device he can’t consult.*
The action bar above the table allows the user to choose the reports to display using available filters but also the adding or deleting reports actions.
In the left column named “LAST REPORTS” are the last edited reports. To retrive an earlier report, you must open the“Document Space” by clicking on the command below the column heading.
Create a report
Click on “Maintenance” in the MySirius general menu bar then on “Reporting” indicator. Then click on the button “Creating a report” In the action bar above the list of the report.
A window opens asking you to name and choose the type of the report you want to create. Make your choices on the different screens that will be proposed:
- Report and Data Type : Choose the type of report (PDF or Email) and Data (measures, stats …)
- Report targets : Choose the units or batches on which the report will relate
- Recipients : Choose the report destination :
- Either send it to the “document space” (space dedicated to store documents as reports or metrological certificate in a future release)
Either send it by mail to one or more recipients
- Frequency of execution : Periodicity of report edition. It’s possible to create manual reports which can be generated by clicking on the button

Culture : Choose the language in which the report will be generates
Before validation, the report creation a summary is displayed.
Delete a report
Click in the checkbox in front of the name of the report to delete and then on the button representing a bin in the action bar above the table. The generated reports are available in MySirius for a limited period of time depending on their periodicity. - Daily: 15 days - Weekly: 9 weeks - Monthly: 3 months - Annual: 2 years
Edit a report
Click on the report name to modify then the window summerizing the report opens. Then click on “Edit” to enter modification mode.
The report modification is done in the same way as the creation exepted that the choices are préset regarding the initial report configuration. All you hav to do is to modify or pass to the next screen until the end. Once the summary displayed, validate the modification of the report.
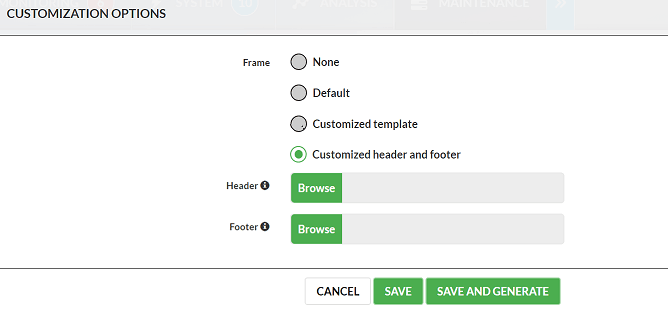
Customize a report
It’s possible to customize the generated reports by importing an existing PDF template. You can also add your own Headers and Footers. use the “REPORT OPTIONS” button, choose the template, headers/footers to import then “SAVE” or “SAVE/GENERATE” to visualize the report.
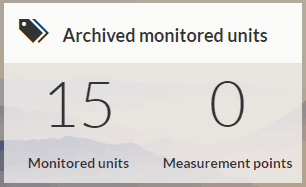
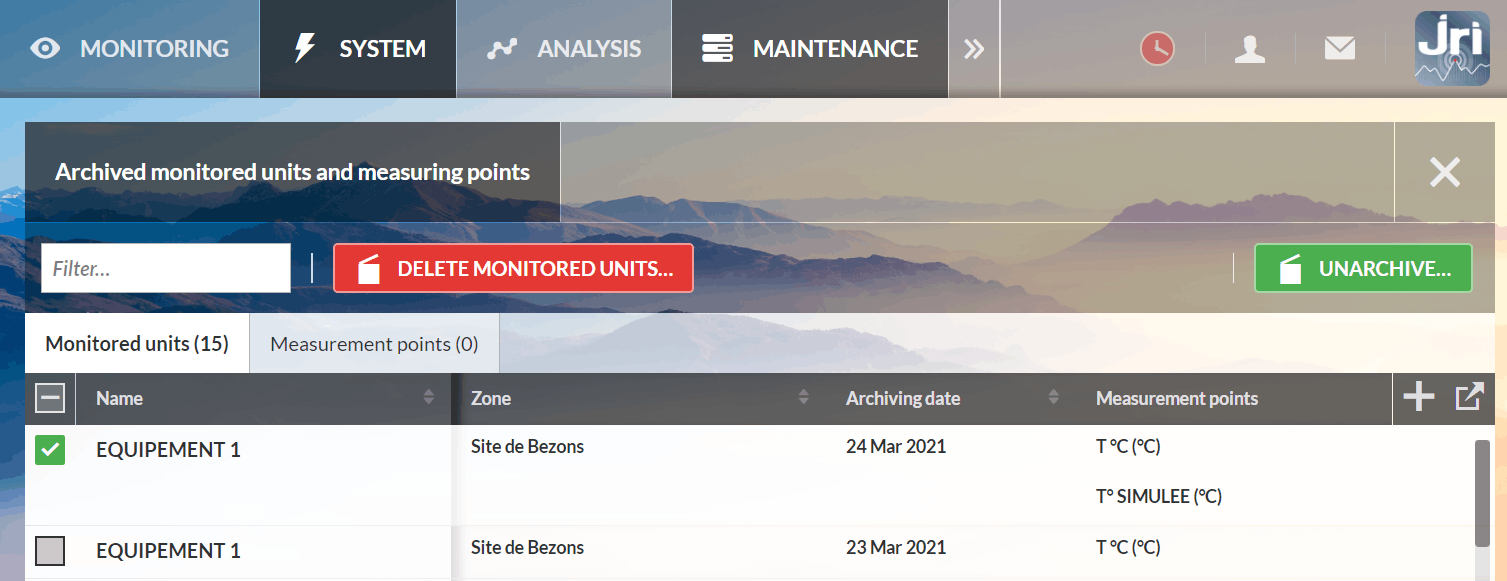
Archived monitored units
From version 2.2 of MySirius, it is possible to visualize data of an archived monitored unit or measurement point. In the MAINTENANCE tab , go to the Archived Monitored Units tile then click on a name of a monitored unit.
If you select an archived monitored unit from the list, you can do 2 actions:
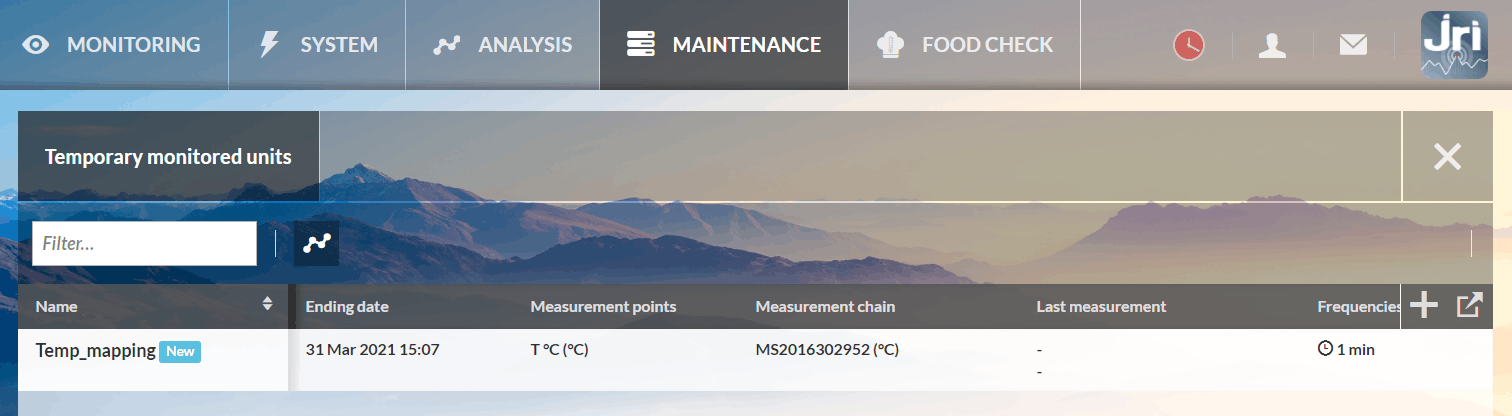
Temporary monitored units
A temporary monitored unit can be created to generate measurements for metrological operations (mapping, calibration). There is no alarm management or data visualization in the monitoring tab for these monitored units and they are automatically deleted one month after the end date for recording measurements. The visualization / export of measurements is done by clicking on the button 
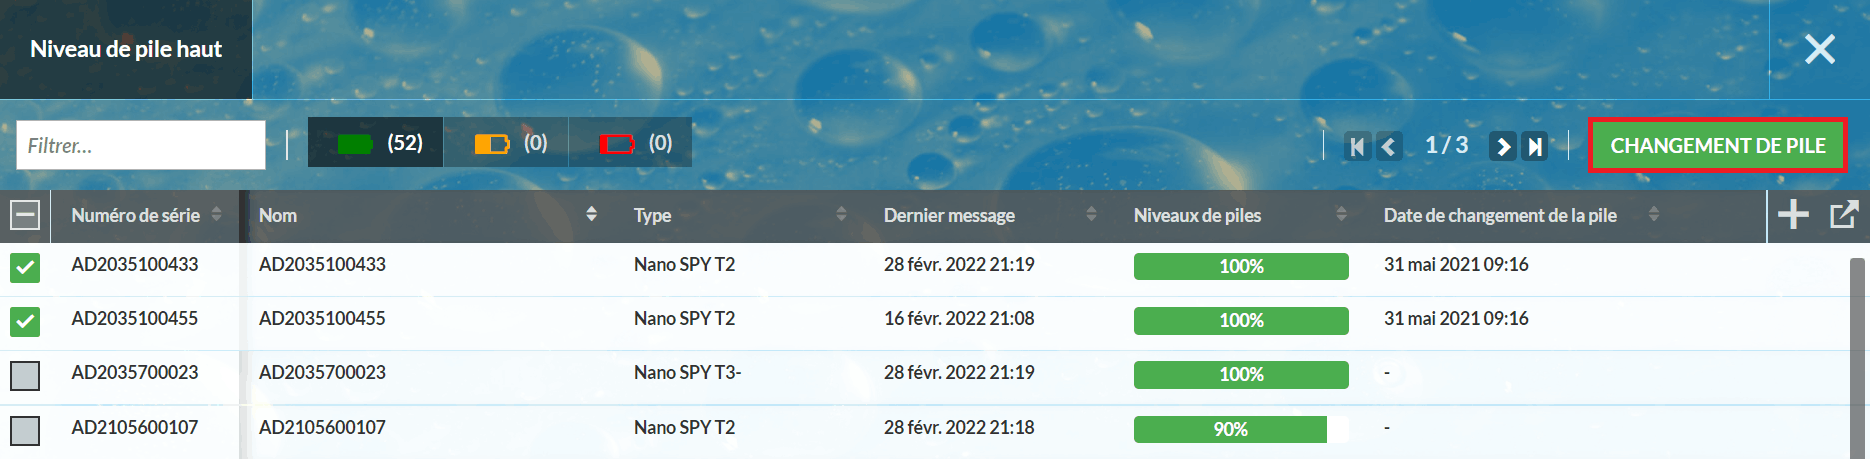
Battery level
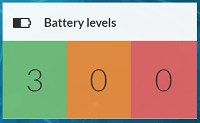
This tile allows you to check the battery levels of your devices in order to anticipate replacement operations. It is possible to enter a battery change date by selecting one or more devices, then clicking on the BATTERY CHANGE button An export of the table is possible.
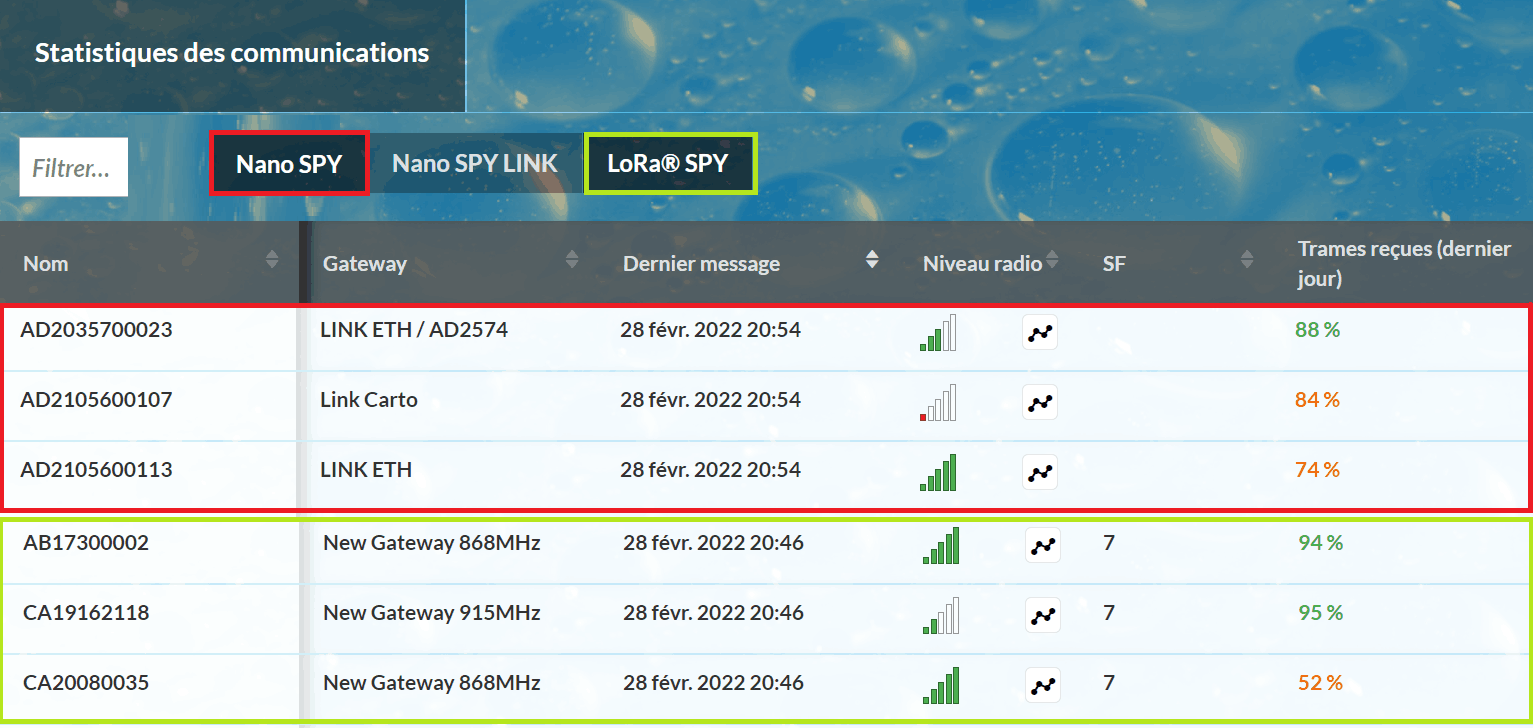
Communicatios level
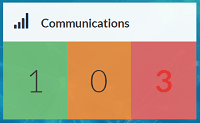
This tile allows you to view the level/quality of communications in order to optimise your installation. Examples of available information: - Date and time of last message - Radio level: RSSI (signal strength) and SF (signal quality variations - only for LoRa). Clicking on the “mini-graph” button displays more details you can export. - Received frames (last day or last 3 days)
- Measurements recovery (last 3 days)
- Percentage of successful requests (last day) - Re-transmitted frames (last 3 days): Frames re-transmitted by the Nova SPY or Nano SPY in case of non confirmation of reception by MySirius - Duplicated frames (last 3 days): Nova SPY or Nano SPY frames seen by several Links/Relays - Number of connections last day: Broadcast frames sent in case of non-detection of a Link/Relay